I am about ready to smash my fist through a wall. It turns out there were also duplicates in the quasar file.... here are the numbers/plots from yesterday with the quasar duplicates and target duplicates removed. Here's a cute piece of code to remove them (from Adam):
a = mdrfits('knownQSO+BOSS.fits',1) spherematch, a.ra, a.dec, a.ra, a.dec, 2./3600, m1, m2, maxmatch=0 dups = m1[where(m1 gt m2)] good = [indgen(n_elements(a))*0]+1 good[dups]=0 dupsremoved = a[where(good)] mwrfits,dupsremoved,'knownQSO+BOSS.nodup.fits',/create
And also code from Erin for removing BOSS duplicates:
targetplatefile = './targetallfile.fits'
targets= mrdfits(targetplatefile, 1)
pid = photoid(targets)
targets = targets[rem_dup(pid)]
Below are my new numbers (as compared to Adam's table) with a QSO redshift range 2.2 < z < 3.5:
Threshold # QSOs per deg^2If I use Myers' thresholds I get the following:
20/deg^2 40/deg^2 20/deg^2 40/deg^2
Likelihood v1 0.7623 0.46035 7.14 10.85
Likelihood v2 0.2433 0.12765 8.09 10.64
                  Threshold         # QSOs per deg^2
             20/deg^2  40/deg^2   20/deg^2  40/deg^2
Likelihood v1  0.533     0.235       5.93     6.96
Likelihood v2  0.200     0.071       7.30     6.86
Adam get's the following numbers:
                  Threshold         # QSOs per deg^2
             20/deg^2  40/deg^2   20/deg^2  40/deg^2
Likelihood v1  0.533     0.235       8.81    12.23
Likelihood v2  0.200     0.071       8.25    11.18
I suspect that Adam might be calculating the # per deg^2 taking the number of QSOs and dividing by 20/40. This doesn't seem right to me, because I am getting significantly different numbers of target fibers using these thresholds for the v1 vs v2 likelihoods (2848 for v1, 2060 for v2) and so simply dividing by 20/40 favors the old likelihood because we are giving more fibers to that version.
This is why I use:
# QSOs per deg^2 = # targeted QSOs / (total # targets / # per square degree)
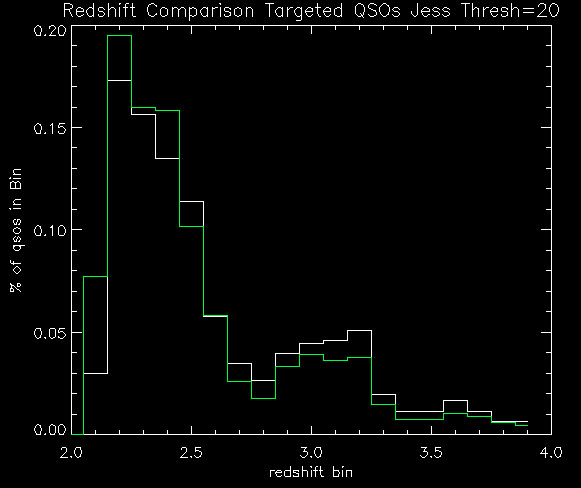
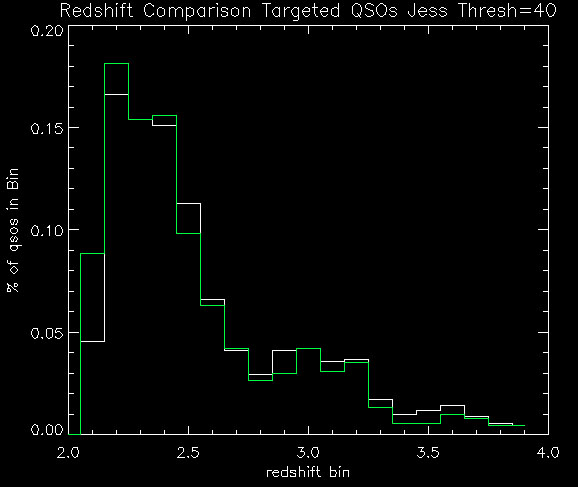
There is also a question of changes in the distribution of likelihood ratio for the v1 vs v2. We would expect very different values for likelihood ratio because we are now modeling low/high redshift QSOs and adding them to the denominator, I am not sure if comparing these values tells us much. I think a more significant test is looking at the distribution of the redshift of the QSOs for v1 vs v2. We do seem to be targeting more low QSOs with the v2. This could possibly be corrected by implementing the McDonald score. I have the code to do this. Hennawi seems to think that the Richard's luminosity function doesn't work well at high redshifts. Now that I have removed the duplicates I need to re-test all the different luminosity functions again anyway. I can do this with and without the McDonald score for each luminosity function.
Below are plots (same as yesterday's post) + the likelihood ratio distributions. Again, white is v1 (old) and green is v2 (new):


No comments:
Post a Comment