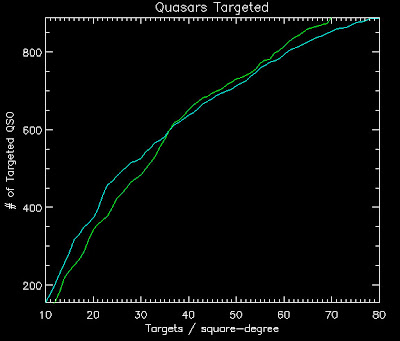
Below are the lratio thresholds for the old version of the likelihood (v1) and the likelihood with ALL the Quasars as a function of targets per square degree (TPSD):
TPSD ----- v1 threshold - all quasar threshold
10.0000 ----- 0.996883 ----- 0.984691
20.0000 ----- 0.868663 ----- 0.795943
30.0000 ----- 0.674674 ----- 0.629976
40.0000 ----- 0.496851 ----- 0.522806
50.0000 ----- 0.403819 ----- 0.441149
60.0000 ----- 0.318171 ----- 0.363089
70.0000 ----- 0.262071 ----- 0.310237
80.0000 ----- 0.215056 ----- 0.268664
Here's a plot
Cyan is the ALL the Quasars
Green is likelihood v1
Cyan is the ALL the Quasars
Green is likelihood v1
Using these thresholds here are the number of quasars targeted:
TPSD ---- #QSOs (v1) --- #QSOs (ALL quasars)
10.0000 -- 132.000 ----- 155.000
20.0000 -- 343.000 ----- 374.000
30.0000 -- 484.000 ----- 527.000
40.0000 -- 651.000 ----- 638.000
50.0000 -- 731.000 ----- 713.000
60.0000 -- 815.000 ----- 793.000
70.0000 -- 888.000 ----- 853.000
80.0000 -- 944.000 ----- 889.000
Here's a plot
Cyan is the ALL the Quasars
Green is likelihood v1
Cyan is the ALL the Quasars
Green is likelihood v1


No comments:
Post a Comment