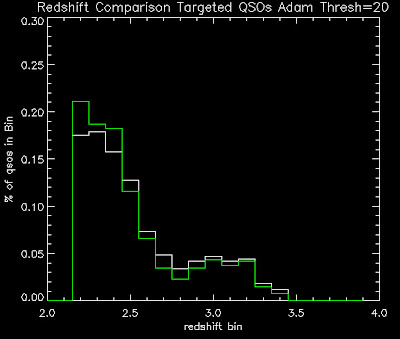
Adam Myers got significantly different results when he tested the new likelihood. After some debugging, we realized that I was duplicating some targets in my targetallfile.fits file which was effecting my results. I've now removed all duplicates and re-ran the Likelihood Test (4) (see log file ../logs/100505log.pro for code). Below are my new numbers (as compared to Adam's table) with a QSO redshift range 2.2 < z < 3.5:
                  Threshold         # QSOs per deg^2
             20/deg^2  40/deg^2   20/deg^2  40/deg^2
Likelihood v1  0.7623   0.46035      6.50      9.77
Likelihood v2  0.2433   0.12765      7.14      9.31
This shows an improvements at 20/deg^2 but not at 40/deg^2.
The puzzling thing is that even when I remove the duplicates I am still getting dramatically different thresholds compared with Myers. If I use Myers' thresholds I get the following:
The puzzling thing is that even when I remove the duplicates I am still getting dramatically different thresholds compared with Myers. If I use Myers' thresholds I get the following:
                  Threshold         # QSOs per deg^2
             20/deg^2  40/deg^2   20/deg^2  40/deg^2
Likelihood v1  0.533     0.235       5.38     3.084
Likelihood v2  0.200     0.071       6.45     3.016
I get the number per square degree by taking the total # of targeted QSOs, and then dividing by the total number of targets and then multiplying by the number of targets per square degree:
# targeted QSOs / (total # targets / # per square degree)
I do this because using Myers' thresholds gives us different number of targets for v1 and v2 so this seems like the best way to directly compare the numbers.
Below are a bunch of plots of the redshift distributions of the quasars for the above thresholds. The white is likelihood v1 (old) and green is likelihood v2 (new). Targeted QSOs are all QSOs targeted by the two methods, unique QSOs are QSOs only targeted by one method or the other:


No comments:
Post a Comment