Friday, August 27, 2010

Recomputing Efficiency and Completeness

I recomputed the Efficiency and Completeness using Stripe 82 BOSS Data:

To determine performance of the likelihood method, we calculated probabilities on single-epoch data in Stripe-82 and compared that target list with the commissioning truth table (which includes targets from all targeting methods and all previously known quasars). Likelihood probabilities were calculated on 112,809 objects and of those the top 1,450 likelihoods were selected for a target density of 40 objects per square-degree. We found an efficiency (# QSOs Found /# Total Targets) of 63% and the completeness (# QSOs Found by likelihood with 40 targets per square-degree / #QSOs found in region targeted by three methods with 80 targets per square-degree) is 55%.

The code to perform this calculation is here:
../logs/100827_2log.pro

It is a little strange because the truth table does not include all of stripe 82, so to understand the efficiencies we need to figure out the fraction of Stripe 82 which is covered by the truth table:

fraction = n_elements(targetNRA)*1.0/n_elements(where(stripe82targets.l_ratio GE threshold))*1.0 ;Fraction of stripe 82 observed

fraction = 14.5%

So the total number of targets is not the full number of objects in Erin's median seeing file, but ~14.5% of those objects.

Here are some plots:
Likelihood Selected QSOs:
Likelihood Missed QSOs:
Likelihood Selected/Missed QSOs together:
Likelihood Selected Stars:

All Three:

Code for these plots is also in the following log:
../logs/100827_2log.pro

More LF Plots


The code to make these plots is here:
../logs/100827log.pro

Thursday, August 26, 2010

Luminosity Function Plots

Here's the code to make it:file1 = '/home/jessica/lumnew/dNdz_hrh_z_0.5-5.0.dat'
file2 = '/home/jessica/lumnew/dNdz_jiang_z_0.5-5.0.dat'
file3 = '/home/jessica/lumnew/dNdz_richards_z_0.5-5.0.dat'
file4 = "/home/jessica/repository/ccpzcalib/Jessica/likelihood/qsocatalog/dNdz_qso_z0.5-5.0JiangCombo.dat"


rdfloat,file1,hrh_z,hrh_dndz,skip=1
hrh_pz=(hrh_dndz-shift(hrh_dndz,1))/(hrh_z-shift(hrh_z,1))
plot, hrh_z[1:119], hrh_pz[1:119]

rdfloat,file2,j_z,j_dndz,skip=1
j_pz=(j_dndz-shift(j_dndz,1))/(j_z-shift(j_z,1))
oplot, j_z[1:119], j_pz[1:119], color = 1

rdfloat,file3,r_z,r_dndz,skip=1
r_pz=(r_dndz-shift(r_dndz,1))/(r_z-shift(r_z,1))
oplot, r_z[1:119], r_pz[1:119], color = 2

;Turn on colors
device,true_color=24,decomposed=0,retain=2

;Set up fonts
!P.FONT = -1
!P.THICK = 1
DEVICE, SET_FONT ='Times Bold',/TT_FONT

white = GetColor('White', 1)
black = GetColor('Black', 2)
green = GetColor('Green', 3)
red = GetColor('Red', 4)
blue = GetColor('Blue',5)
cyan = GetColor('Cyan',5)
magenta = GetColor('Magenta',5)


mtitle = 'Luminosity Functions'
xtitle = 'redshift (z)'
ytitle = 'QSO Distribution'

Window, XSize=800, YSize=700
plot, hrh_z[1:119], hrh_pz[1:119], xrange = [0.5,5], yrange = [0,1], Background=1, Color=black, XTITLE = xtitle, YTITLE = ytitle, TITLE = mtitle, charsize = 2, charthick = 1, thick=2, xthick=2, ythick=2

oplot, hrh_z[1:119], hrh_pz[1:119], Color=blue, thick=2
oplot, j_z[1:119], j_pz[1:119], color = red, thick=2
oplot, r_z[1:119], r_pz[1:119], color = green, thick=2


set_plot, 'ps'
!P.FONT = 0
!P.THICK = 1
aspect_ratio = (7.0/8.0)
xsz = 5.0
ysz = xsz*aspect_ratio
device, filename = 'luminosityFunctions.eps', /color, bits_per_pixel = 8,encapsul=0, xsize=xsz,ysize=ysz, /INCHES, /TIMES, /BOLD

plot, hrh_z[1:119], hrh_pz[1:119], xrange = [0.5,5], yrange = [0,1], Background=1, Color=black, XTITLE = xtitle, YTITLE = ytitle, TITLE = mtitle, charsize = 1, charthick = 1, thick=2, xthick=2, ythick=2
oplot, hrh_z[1:119], hrh_pz[1:119], Color=blue, thick=2
oplot, j_z[1:119], j_pz[1:119], color = red, thick=2
oplot, r_z[1:119], r_pz[1:119], color = green, thick=2

device, /close
set_plot,'X'
!P.FONT = -1
!P.THICK = 1
DEVICE, SET_FONT ='Times Bold',/TT_FONT

All code is in following log file:
../logs/100826log.pro


code to make above plot is here:
../logs/100826_2log.pro

Wednesday, August 25, 2010

Comparing Luminosity Functions

Here is instructions for running different luminosity functions for comparison:

;Changing the luminosity function with Joe's new code
;code location: /home/jessica/lumnew

1) Change the location where the luminosity function is saved.
a) Open hiz_qso_dndz.pro
b) Change textout = './locationToSave.dat'
c) Change the LUMFUNCTION so that it is using the one you want it to:
LUMFUNCTION = 'HRH07' ; Hopkins, Richards, Hernquist 2007
;LUMFUNCTION = 'J06' ; Jiang 2006
;LUMFUNCTION = 'R06' ; Richards 2006
d) Change Z_MIN and Z_MAX to be the proper redshift range.

2) Run hiz_qso_dndz make quasar luminosity function:
idl runlumfunc.pro lum.out 2> lum.err &

3) Change hiz_kde_numerator.pro to point to the luminosity function:
dNdz_file = './dNdz_hrh_z_0.5-5.0.dat'
LUMFUNC = 'HRH07'

dNdz_file = './dNdz_jiang_z_0.5-5.0.dat'
LUMFUNC = 'J06'

dNdz_file = './dNdz_richards_z_0.5-5.0.dat'
LUMFUNC = 'R06'

4) Run hiz_kde_numerator.pro QSO Catalog:
idl hiz_kde_numerator.pro hkn.out 2> hkn.err &

Generates the following QSO Catalogs:
QSO_Catalog_HRH_07.fits
QSO_Catalog_Jiang_06.fits
QSO_Catalog_Richards_06.fits

5) Change likelihood_compute.pro so it points to new catalogs:

file2 = "/home/jessica/lumnew/QSO_Catalog_HRH_07.fits"
file2 = "/home/jessica/lumnew/QSO_Catalog_Richards_06.fits"
file2 = "/home/jessica/lumnew/QSO_Catalog_Jiang_06.fits"

6) Run likelihood.script

./likelihood.script hrh07
./likelihood.script j06run
./likelihood.script r06run

Also in the following log file:
.../logs/100825log.pro

Tuesday, August 17, 2010

Overlapping Contours


;Turn on colors
device,true_color=24,decomposed=0,retain=2

;Set up fonts
!P.FONT = -1
!P.THICK = 1
DEVICE, SET_FONT ='Times Bold',/TT_FONT

white = GetColor('White', 1)
black = GetColor('Black', 2)
green = GetColor('Green', 3)
red = GetColor('Red', 4)
blue = GetColor('Blue',5)

LoadCT, 33, NColors=levels, Bottom=3


;Set up contour data
bin_width = 0.05
minx=-1.0
miny=-0.5
maxx=4
maxy=2

star_contours = HIST_2D(ugscolor, grscolor, bin1=bin_width, bin2=bin_width, max1=maxx, MAX2=maxy, MIN1=minx, MIN2=miny)

;; This sets up (max1-min1)bin1 bins in X....
x_cont = findgen(n_elements(star_contours[*,1]))
sx_cont = (x_cont*bin_width) + minx

;; And 60 bins in y
y_cont = findgen(n_elements(star_contours[1,*]))
sy_cont = (y_cont*bin_width) + miny


qso_contours = HIST_2D(ugqcolor, grqcolor, bin1=bin_width, bin2=bin_width, max1=maxx, MAX2=maxy, MIN1=minx, MIN2=miny)

;; This sets up (max1-min1)bin1 bins in X....
x_cont = findgen(n_elements(qso_contours[*,1]))
qx_cont = (x_cont*bin_width) + minx

;; And 60 bins in y
y_cont = findgen(n_elements(qso_contours[1,*]))
qy_cont = (y_cont*bin_width) + miny

levels = 10
userlevels = findgen(levels)^2.5
maxlevel = max(userlevels)
smax = max(star_contours)*1.1
slevels = userlevels*smax/maxlevel

levels = 7
userlevels = findgen(levels)^2.5
maxlevel = max(userlevels)
qmax = max(qso_contours)*1.1
qlevels = userlevels*qmax/maxlevel

mtitle = 'Color-Color Contour Plot'
xtitle = 'u-g magnitude'
ytitle = 'g-r magnitude'

Window, XSize=800, YSize=700
Contour, star_contours, sx_cont, sy_cont, C_Colors=red, Background=1, Levels=slevels, Color=black, XTITLE = xtitle, YTITLE = ytitle, TITLE = mtitle, charsize = 2, charthick = 1, thick=2, xthick=2, ythick=2
Contour, qso_contours, qx_cont, qy_cont, /Overplot, Levels=qLevels, Color=blue, thick=2


set_plot, 'ps'
!P.FONT = 0
!P.THICK = 1
aspect_ratio = (7.0/8.0)
xsz = 5.0
ysz = xsz*aspect_ratio
device, filename = 'contourqsostar.eps', /color, bits_per_pixel = 8,encapsul=0, xsize=xsz,ysize=ysz, /INCHES, /TIMES, /BOLD

Contour, star_contours, sx_cont, sy_cont, C_Colors=red, Background=1, Levels=slevels, Color=black, XTITLE = xtitle, YTITLE = ytitle, TITLE = mtitle, charsize = 1, charthick = 1, thick=2, xthick=2, ythick=2
Contour, qso_contours, qx_cont, qy_cont, /Overplot, Levels=qLevels, Color=blue, thick=2

device, /close
set_plot,'X'
!P.FONT = -1
!P.THICK = 1
DEVICE, SET_FONT ='Times Bold',/TT_FONT

log file:

../logs/100817log.pro

Monday, August 16, 2010

Final Plotting

From this page we see how to do color contour plots: http://www.dfanning.com/tips/contour_hole.html

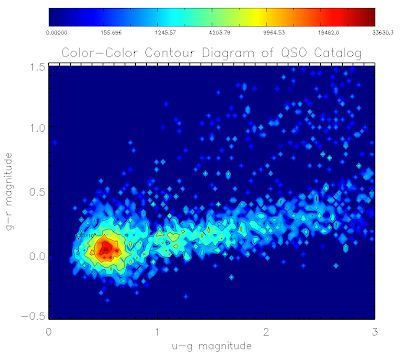
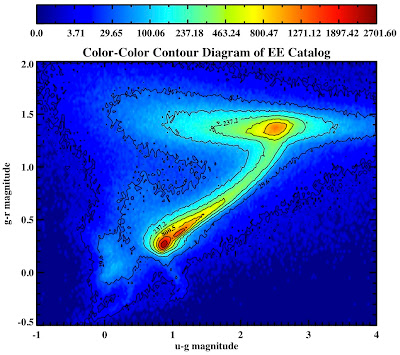
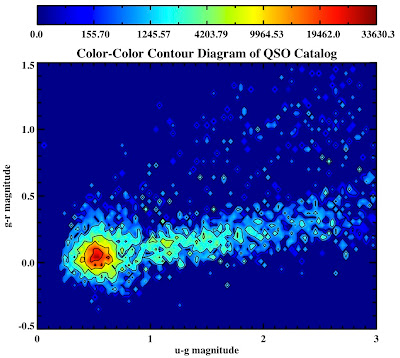
Here are the plots for the QSO and EE catalogs:

Here is the code to make them... I've used non-linear color levels to show peaks better...
For everything else catalog:

file1 = filepath('Likeli_everything.fits', root_dir=getenv('BOSSTARGET_DIR'), subdir='data')

;file1 = './Likeli_everything.fits.gz'
.com likelihood_compute
startemplate = likelihood_everything_file(file1, area=area1)


;Get magnitudes
;Star Magnitudes (don't need to deredden)
smag = 22.5 - 2.5*alog10(startemplate.psfflux>1.0d-3)
ugscolor = smag[0,*] - smag[1,*]
grscolor = smag[1,*] - smag[2,*]


;Turn on colors
device,true_color=24,decomposed=0,retain=2

;Set up fonts
!P.FONT = -1
!P.THICK = 1
DEVICE, SET_FONT ='Times Bold',/TT_FONT

bin_width = 0.025
minx=-1.0
miny=-0.5
maxx=4
maxy=2

;Create contours
star_contours = HIST_2D(ugscolor, grscolor, bin1=bin_width, bin2=bin_width, max1=maxx, MAX2=maxy, MIN1=minx, MIN2=miny)

;; This sets up (max1-min1)bin1 bins in X....
x_cont = findgen(n_elements(star_contours[*,1]))
x_cont = (x_cont*bin_width) + minx

;; And bins in y
y_cont = findgen(n_elements(star_contours[1,*]))
y_cont = (y_cont*bin_width) + miny

;Set up plot titles
xtitle = 'u-g magnitude'
ytitle = 'g-r magnitude'
mtitle = 'Color-Color Contour Plot EE Catalog'

levels = 256 ;plot in 256 colors
data = star_contours
x = x_cont
y = y_cont
white = GetColor('White', 1) ; know what is white
black = GetColor('Black', 2) ; know what is black
;load blue-red color table
LoadCT, 33, NColors=levels, Bottom=3

;define the levels of the color contours
;non linear to show data shape better
userlevels = findgen(levels)^3
maxlevel = max(userlevels)
thismax = max(star_contours)*1.1
userlevels = userlevels*thismax/maxlevel

;define the levels of the contour lines
;non linear to show data shape better
;only ten lines so that the text is legible
slevels = 10
suserlevels = findgen(slevels)^3
maxlevel = max(suserlevels)
thismax = max(star_contours)*1.1
suserlevels = suserlevels*thismax/maxlevel

; make window
Window, XSize=800, YSize=700
;Make contour plot
Contour, data, x, y, /Fill, C_Colors=Indgen(levels)+3, Background=1, Levels=userlevels, Position=[0.12, 0.1, 0.9, 0.80], Color=black, XTITLE = xtitle, YTITLE = ytitle, TITLE = mtitle, charsize = 2, charthick = 1, thick=1, xthick=2, ythick=2
;Overplot black lines
Contour, data, x, y, /Overplot, Levels=suserLevels, /Follow, Color=black
;Make color bar
ColorBar, NColors=levels, Bottom=3, Divisions=slevels-1, TICKNAMES=suserlevels, Range=[Min(data), Max(data)], Format='(G8.5)', Position = [0.12, 0.9, 0.9, 0.95], Color=black


Similarly for the qso catalog:


bin_width = 0.03
minx=0.0
miny=-0.5
maxx=3.0
maxy=1.5

qso_contours = HIST_2D(ugqcolor, grqcolor, bin1=bin_width, bin2=bin_width, max1=maxx, MAX2=maxy, MIN1=minx, MIN2=miny)

;; This sets up (max1-min1)bin1 bins in X....
x_cont = findgen(n_elements(qso_contours[*,1]))
x_cont = (x_cont*bin_width) + minx

;; And 60 bins in y
y_cont = findgen(n_elements(qso_contours[1,*]))
y_cont = (y_cont*bin_width) + miny


xtitle = 'u-g magnitude'
ytitle = 'g-r magnitude'
mtitle = 'Color-Color Contour Diagram of QSO Catalog'

levels = 256
data = qso_contours
x = x_cont
y = y_cont
white = GetColor('White', 1)
black = GetColor('Black', 2)
LoadCT, 33, NColors=levels, Bottom=3

userlevels = findgen(levels)^3
maxlevel = max(userlevels)
thismax = max(qso_contours)*1.1
userlevels = userlevels*thismax/maxlevel

slevels = 7
suserlevels = findgen(slevels)^3
maxlevel = max(suserlevels)
thismax = max(qso_contours)*1.1
suserlevels = suserlevels*thismax/maxlevel


Window, XSize=800, YSize=700

Contour, data, x, y, /Fill, C_Colors=Indgen(levels)+3, Background=1, Levels=userlevels, Position=[0.12, 0.1, 0.9, 0.80], Color=black, XTITLE = xtitle, YTITLE = ytitle, TITLE = mtitle, charsize = 2, charthick = 1, thick=1, xthick=2, ythick=2
Contour, data, x, y, /Overplot, Levels=suserLevels, /Follow, Color=black
ColorBar, NColors=levels, Bottom=3, Divisions=slevels-1, TICKNAMES=suserlevels, Range=[Min(data), Max(data)], Format='(G10.5)', Position = [0.12, 0.9, 0.9, 0.95], Color=black


And to make the plots to files:

set_plot, 'ps'
!P.FONT = 0
!P.THICK = 1
aspect_ratio = (7.0/8.0)
xsz = 7.0
ysz = xsz*aspect_ratio
device, filename = 'contourstars.eps', /color, bits_per_pixel = 8,encapsul=0, xsize=xsz,ysize=ysz, /INCHES, /TIMES, /BOLD

Contour, data, x, y, /Fill, C_Colors=Indgen(levels)+3, Background=1, Levels=userlevels, Position=[0.11, 0.1, 0.9, 0.80], Color=black, XTITLE = xtitle, YTITLE = ytitle, TITLE = mtitle, charsize = 1, charthick = 1, thick=1, xthick=2, ythick=2
Contour, data, x, y, /Overplot, Levels=suserLevels, /Follow, Color=black
ColorBar, NColors=levels, Bottom=3, Divisions=slevels-1, TICKNAMES=suserlevels, Range=[Min(data), Max(data)], Format='(G8.5)', Position = [0.11, 0.9, 0.9, 0.95], Color=black


device, /close
set_plot,'X'
!P.FONT = -1
!P.THICK = 1
DEVICE, SET_FONT ='Times Bold',/TT_FONT


bin_width = 0.03
minx=0.0
miny=-0.5
maxx=3.0
maxy=1.5

qso_contours = HIST_2D(ugqcolor, grqcolor, bin1=bin_width, bin2=bin_width, max1=maxx, MAX2=maxy, MIN1=minx, MIN2=miny)

;; This sets up (max1-min1)bin1 bins in X....
x_cont = findgen(n_elements(qso_contours[*,1]))
x_cont = (x_cont*bin_width) + minx

;; And 60 bins in y
y_cont = findgen(n_elements(qso_contours[1,*]))
y_cont = (y_cont*bin_width) + miny


xtitle = 'u-g magnitude'
ytitle = 'g-r magnitude'
mtitle = 'Color-Color Contour Diagram of QSO Catalog'

levels = 256
data = qso_contours
x = x_cont
y = y_cont
white = GetColor('White', 1)
black = GetColor('Black', 2)
LoadCT, 33, NColors=levels, Bottom=3

userlevels = findgen(levels)^3
maxlevel = max(userlevels)
thismax = max(qso_contours)*1.1
userlevels = userlevels*thismax/maxlevel

slevels = 7
suserlevels = findgen(slevels)^3
maxlevel = max(suserlevels)
thismax = max(qso_contours)*1.1
suserlevels = suserlevels*thismax/maxlevel

set_plot, 'ps'
!P.FONT = 0
!P.THICK = 1
aspect_ratio = (7.0/8.0)
xsz = 7.0
ysz = xsz*aspect_ratio
device, filename = 'contourqsos.eps', /color, bits_per_pixel = 8,encapsul=0, xsize=xsz,ysize=ysz, /INCHES, /TIMES, /BOLD

Contour, data, x, y, /Fill, C_Colors=Indgen(levels)+3, Background=1, Levels=userlevels, Position=[0.12, 0.1, 0.9, 0.80], Color=black, XTITLE = xtitle, YTITLE = ytitle, TITLE = mtitle, charsize = 1, charthick = 1, thick=1, xthick=2, ythick=2
Contour, data, x, y, /Overplot, Levels=suserLevels, /Follow, Color=black
ColorBar, NColors=levels, Bottom=3, Divisions=slevels-1, TICKNAMES=suserlevels, Range=[Min(data), Max(data)], Format='(G10.5)', Position = [0.12, 0.9, 0.9, 0.95], Color=black

device, /close
set_plot,'X'
!P.FONT = -1
!P.THICK = 1
DEVICE, SET_FONT ='Times Bold',/TT_FONT

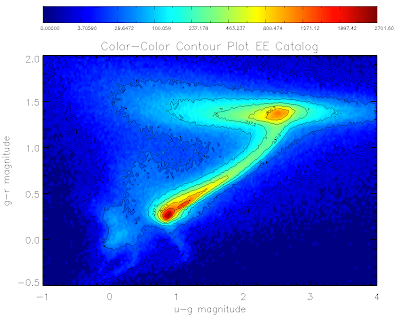
See they look pretty:


All in the following log file:
../logs/100816log.pro

Friday, August 13, 2010

More Plotting

More plotting....

Plot to a file:
;Save color-color diagram to file
set_plot, 'ps'
!P.FONT = 0
!P.THICK = 2
aspect_ratio = (6.0/7.0)
xsz = 4.0
ysz = xsz*aspect_ratio
device, filename = 'ccstars.eps', /color, bits_per_pixel = 8,encapsul=0, xsize=xsz,ysize=ysz, /INCHES, /TIMES, /BOLD
ccplot, xobject, yobject, xtitle, ytitle, mtitle
device, /close
set_plot,'X'

or (from here -- note I needed to change /encapsul command to device to encapsul=0)

to_eps, /eps, device=device
ccplot, xobject, yobject, xtitle, ytitle, mtitle
to_eps, /eps, device=device, /out

It looks pretty:
Contour plot with non-linear contour levels:
!P.FONT = -1
mtitle = 'Color-Color Contour Plot'
levels = findgen(25)^2*16
contour,star_contours,x_cont,y_cont,levels=levels,XTITLE = xtitle, YTITLE = ytitle, TITLE = mtitle, charsize = 2, charthick = 1, thick=1, xthick=1,/follow


Contour plot shaded:
levels = findgen(25)^2*16
contour,star_contours,x_cont,y_cont,levels=levels,XTITLE = xtitle, YTITLE = ytitle, TITLE = mtitle, charsize = 2, charthick = 1, thick=1, xthick=2, ythick=2,/cell_fill


To overlay levels:
window,xsize=700,ysize=600
loadct, 0
nlevels = 15
levels = findgen(nlevels)^4
maxlevel = max(levels)
thismax = max(star_contours)
levels = levels*thismax/maxlevel
contour,star_contours,x_cont,y_cont,levels=levels,XTITLE = xtitle, YTITLE = ytitle, TITLE = mtitle, charsize = 2, charthick = 1, thick=1, xthick=2, ythick=2,/cell_fill
contour,star_contours,x_cont,y_cont,levels=levels,/follow,/overplot

Thursday, August 12, 2010

Contour Plots

Nic wants me to put some contour plots in my likelihood paper. Here is some playing to make the plots....

From this tutorial: http://xweb.geos.ed.ac.uk/~hcp/notes/node4.html

I'm using the "everything else" catalog as my data to plot.

Color-Color Scatter Plot

The code:

!P.FONT = 1
!P.THICK = 2
DEVICE, SET_FONT ='Times',/TT_FONT

xtitle = 'u-g magnitude'
ytitle = 'g-r magnitude'
mtitle = 'Color-Color Diagram All Input QSOs'

window,xsize=700,ysize=600
plot, ugscolor[0:2], grscolor[0:2], ps=3, xr=[-0.5,4],yr=[-0.5,2],XTITLE = xtitle, YTITLE = ytitle, TITLE = mtitle, charsize = 2, charthick = 1
;Stars
oplot, ugscolor[ii], grscolor[ii], ps=3, color=fsc_color('red')

Mesh Surface Plot

The Code:

bin_width = 0.05
minx=-0.5
miny=-0.5
maxx=4
maxy=2

star_contours = HIST_2D(ugscolor, grscolor, bin1=bin_width, bin2=bin_width, max1=maxx, MAX2=maxy, MIN1=minx, MIN2=miny)

;; This sets up (max1-min1)bin1 bins in X....
x_cont = findgen(n_elements(star_contours[*,1]))
x_cont = (x_cont*bin_width) + minx

;; And 60 bins in y
y_cont = findgen(n_elements(star_contours[1,*]))
y_cont = (y_cont*bin_width) + miny


;Mesh surface
xtitle = 'u-g magnitude'
ytitle = 'g-r magnitude'
ztitle = 'density'
mtitle = 'Color-Color Density Plot'

window,xsize=700,ysize=600
!P.THICK = 1

surface,star_contours,x_cont,y_cont,XTITLE = xtitle, YTITLE = ytitle, ZTITLE=ztitle, TITLE = mtitle, charsize = 4, charthick = 1, ax = 45, az = 10

B&W Shaded Surface
The code:
shade_surf,star_contours,x_cont,y_cont,XTITLE = xtitle, YTITLE = ytitle, ZTITLE=ztitle, TITLE = mtitle, charsize = 4, charthick = 1, ax = 45, az = 10

B&W Contour Plot

The Code:
mtitle = 'Color-Color Contour Plot'
contour,star_contours,x_cont,y_cont,levels=findgen(75)*100,XTITLE = xtitle, YTITLE = ytitle, TITLE = mtitle, charsize = 2, charthick = 1,/follow

logfile: ../logs/100812log.pro

Friday, August 6, 2010

HRH07 Likelihood Results

logfile is here:
../log/100806log.pro and here ../log/100809log.pro

The likelihood results for the Hopkins, Richards, Hernquist 2007 (HRH07) luminosity function:

The way that lratio is calculated (optimized with redshift range for best results):


;Read in computed likelihoods from threshold file
eps = 1e-30
bossqsolike = total(likelihood.L_QSO_Z[16:35],1) ;quasars between redshift 2.1 and 3.5
qsolcut = where(alog10(bossqsolike) LT -9.0)
den = total(targets.L_EVERYTHING_ARRAY[0:4],1) + total(likelihood.L_QSO_Z[0:44],1) + eps
num = bossqsolike + eps
NEWRATIO = num/den
NEWRATIO[qsolcut] = 0 ; eliminate objects with low L_QSO value
likelihood.l_ratio = newratio

Targets/dec^2------v1 threshold----new threshold
-----0------------1.00000--------1.00000
-----10-----------0.749085-------0.641645
-----20-----------0.490932-------0.390440
-----30-----------0.347334-------0.273209
-----40-----------0.253020-------0.195684
-----50-----------0.198630-------0.156788
-----60-----------0.160074-------0.128583
-----70-----------0.128912-------0.105899
-----80-----------0.107913-------0.0899322
-----90-----------0.0917588------0.0786345

Targets/dec^2--# Targeted QSOs:----v1----new version
-----0------------------------1---------1
-----10----------------------443-------426.000
-----20----------------------656-------664.000
-----30----------------------781-------797.000
-----40----------------------897-------902.000
-----50----------------------965-------975.000
-----60---------------------1035-------1030.00
-----70---------------------1089-------1084.00
-----80---------------------1123-------1115.00
-----90---------------------1157-------1146.00

If you look at color-color plots of what was targeted by both version (white), with version 1 (cyan) versus the new version (magenta):


We do seem to be better at targeting QSOs at redshift ~ 3.0 with this version of the method.


Thursday, August 5, 2010

Fast Queue

As suggested by Ben Weaver I have modified my qsub scripts such that the likelihood jobs are submitted to the fast queue:

#PBS -q fast

is added to .../likelihood/likeqsub.script

This should make my scripts go to a higher priority because they are running for under an hour... however so far they still aren't running at all.... I also am not 100% sure that they run in under an hour... so we'll see.

Wednesday, August 4, 2010

Problems with DR7

I've been trying to use DR7 as the input to Joe's Monte Carlo and it just doesn't seem to work at all. I am coming across problems I just don't understand. I modified the dr7 file to include the psffluxes and saved it here:
/home/jessica/boss/dr7qso2.fits

They are now dereddened already and so we don't need to deredden again. Thus I made a file
/home/jessica/repository/ccpzcalib/Jessica/likelihood/qsocatalog/qso_fakephoto_dr7.pro
that doesn't de-redden.

But for some reason this line:
indx_val = value_locate(z, z_sim)

doesn't appear to be doing the right thing anymore. It is matching almost all the z_sim to the same 5 or so redshifts in z.

I've been spending all day trying to get to the bottom of this and I just can't figure it out.

Logfile is here:
../logs/100803log.pro

Tuesday, August 3, 2010

HRH07 QSO Catalog

I am now generating the QSO Catalog in the following location because it has the most up-to-date code:

/home/jessica/lumnew/


Location of file:
/home/jessica/repository/ccpzcalib/Jessica/likelihood/qsocatalog/FAKE_KDE_QSOS-Thu-Aug-5-20:24:45-2010.fits

The likelihood_compute run is here:
/home/jessica/repository/ccpzcalib/Jessica/likelihood/hrh07

Results to follow.

Monday, August 2, 2010

HRH07 LF

Joe has modified his code such that it now can run the Hopkins, Richards, Hernquist 2007 (HRH07) luminosity function. I have put this newest version of the code here on riemann:

/home/jessica/lumnew/

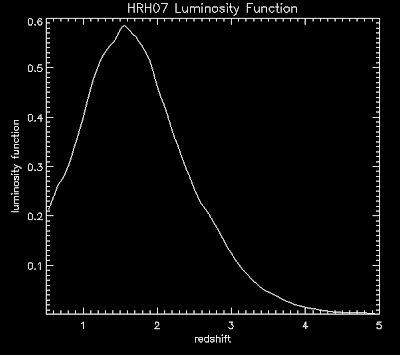
This code takes a pretty long time to run (8 hours) ...but here is what the luminosity function looks like: