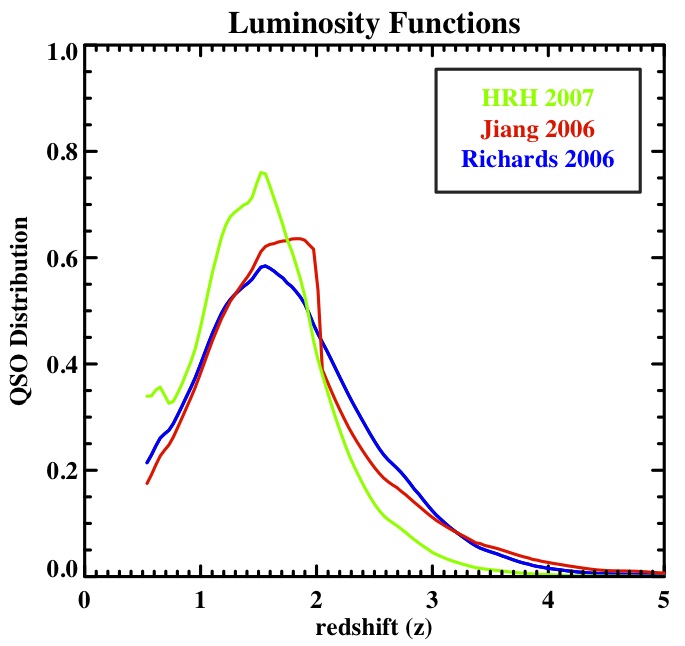
 Here's the code to make it:file1 = '/home/jessica/lumnew/dNdz_hrh_z_0.5-5.0.dat'
file2 = '/home/jessica/lumnew/dNdz_jiang_z_0.5-5.0.dat'
file3 = '/home/jessica/lumnew/dNdz_richards_z_0.5-5.0.dat'
file4 = "/home/jessica/repository/ccpzcalib/Jessica/likelihood/qsocatalog/dNdz_qso_z0.5-5.0JiangCombo.dat"
rdfloat,file1,hrh_z,hrh_dndz,skip=1
hrh_pz=(hrh_dndz-shift(hrh_dndz,1))/(hrh_z-shift(hrh_z,1))
plot, hrh_z[1:119], hrh_pz[1:119]
rdfloat,file2,j_z,j_dndz,skip=1
j_pz=(j_dndz-shift(j_dndz,1))/(j_z-shift(j_z,1))
oplot, j_z[1:119], j_pz[1:119], color = 1
rdfloat,file3,r_z,r_dndz,skip=1
r_pz=(r_dndz-shift(r_dndz,1))/(r_z-shift(r_z,1))
oplot, r_z[1:119], r_pz[1:119], color = 2
;Turn on colors
device,true_color=24,decomposed=0,retain=2
;Set up fonts
!P.FONT = -1
!P.THICK = 1
DEVICE, SET_FONT ='Times Bold',/TT_FONT
white = GetColor('White', 1)
black = GetColor('Black', 2)
green = GetColor('Green', 3)
red = GetColor('Red', 4)
blue = GetColor('Blue',5)
cyan = GetColor('Cyan',5)
magenta = GetColor('Magenta',5)
mtitle = 'Luminosity Functions'
xtitle = 'redshift (z)'
ytitle = 'QSO Distribution'
Window, XSize=800, YSize=700
plot, hrh_z[1:119], hrh_pz[1:119], xrange = [0.5,5], yrange = [0,1], Background=1, Color=black, XTITLE = xtitle, YTITLE = ytitle, TITLE = mtitle, charsize = 2, charthick = 1, thick=2, xthick=2, ythick=2
oplot, hrh_z[1:119], hrh_pz[1:119], Color=blue, thick=2
oplot, j_z[1:119], j_pz[1:119], color = red, thick=2
oplot, r_z[1:119], r_pz[1:119], color = green, thick=2
set_plot, 'ps'
!P.FONT = 0
!P.THICK = 1
aspect_ratio = (7.0/8.0)
xsz = 5.0
ysz = xsz*aspect_ratio
device, filename = 'luminosityFunctions.eps', /color, bits_per_pixel = 8,encapsul=0, xsize=xsz,ysize=ysz, /INCHES, /TIMES, /BOLD
plot, hrh_z[1:119], hrh_pz[1:119], xrange = [0.5,5], yrange = [0,1], Background=1, Color=black, XTITLE = xtitle, YTITLE = ytitle, TITLE = mtitle, charsize = 1, charthick = 1, thick=2, xthick=2, ythick=2
oplot, hrh_z[1:119], hrh_pz[1:119], Color=blue, thick=2
oplot, j_z[1:119], j_pz[1:119], color = red, thick=2
oplot, r_z[1:119], r_pz[1:119], color = green, thick=2
device, /close
set_plot,'X'
!P.FONT = -1
!P.THICK = 1
DEVICE, SET_FONT ='Times Bold',/TT_FONT
All code is in following log file:
../logs/100826log.pro

code to make above plot is here:
../logs/100826_2log.pro

No comments:
Post a Comment