The basic idea of the Newman Method redshift distribution reconstruction code is to take two sets of data which overlap in sky position (ra, dec). One set (let's call it S) is spectroscopic data where we have known redshifts. The other set (P) is photometric data where we do not know the redshifts (or at least don't know them very accurately). Next, I bin S into line of sight (los) distance bins. In the example I am describing here I have binned S from 200 Mpc/h to 1400 Mpc/h with a bin width of 200 Mpc/h. Then we take the angular correlation function, ω(los,θ), [see Landy, Szalay (1993) and Masjedi et al. (2006) for definitions of correlation functions] between each of these binned subsets of S and P. We then take the 3D auto-correlation, ξ(r) of the binned S with itself. The redshift distribution, φ, of P can be reconstructed by inverting the following sum over N bins:
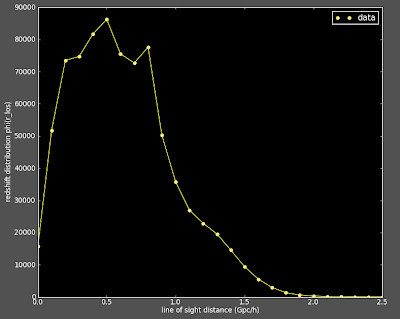
I am applying this method to galaxies in the Sloan data set. Here is what I expect the reconstructed redshift distribution to be (based on the photo-z's of the photometric data):
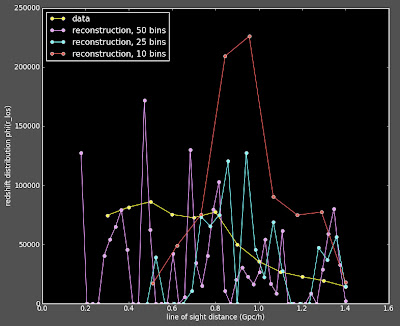
However when I run the reconstruction code, I get answers which do not look anything like this redshift distribution. More disturbing is that I get answer which vary wildly depending on how many φ bins I use in the reconstruction (which makes no sense at all to me). See below plot:
Alexia thinks that perhaps there is something wrong with my 3D-correlation function (it looks pretty featureless and smooth). So the next step is to try different binning of ξ(r) to see if perhaps this allows for better reconstruction -- maybe I am using too many bins and this is causing problems because the correlation function doesn't work properly if it doesn't have enough objects to reconstruct? David suggested that I try running my code on a set of mock data where we know the answer (and we've gotten the code to work before on this data). This will help me separate out if this is a issue with my version of the code, with the data (I am using photometric data and pretending that the photo-z's are the actual redshifts, which may not be good enough), or with the Newman method itself.

No comments:
Post a Comment