Showing posts with label SDSS. Show all posts

Friday, November 4, 2011

Talk at Princeton

I'm at the BOSS QSO Working group meeting at Princeton today. I'm giving a talk. I am still not sure if I can publicly release some of these results/data, but here is the money-slide. It shows that I am getting a clear separation between the clustering signal of the bright quasars (x-axis) and the dim quasars (y-axis) (~3-sigma):
For readers in the SDSS collaboration the full talk and more information is here on the SDSS wiki.

Thursday, November 3, 2011

Talk at Brookhaven

Yesterday I gave the first research seminar of my life. It was a 50 minute talk at Brookhaven National Labs. Overall, I think it went well. The talk was to a small group of research scientists. About half were cosmologists, the other half were physicists of another flavor.

My hosts Erin Sheldon and Anže Slosar gave me some really helpful feed back:
  1. I wasn't expecting such a mixed audience, and I didn't give enough introduction to BOSS, and the data. For instance I didn't directly discuss why quasars are hard to target. I also didn't emphasize that the inputs to the likelihood were the photometric fluxes. I should have talked more about the difference between photometric and spectroscopic data. But in general, I need to be more aware of the audience and beef up the introduction.
  2. I went through the full derivation of the likelihood, and this wasn't necessary.
  3. I was nervous and relied on notecards. Anže said this made it look like I didn't understand what I was talking about. Basically, I need to practice the talk a bunch so I don't need cards.
  4. I mispoke and talked about the first BAO detection. I said it was from SDSS-II, it was actually from SDSS-I.
  5. In general I didn't feel prepared to answer all questions, I need to go through the talk and make sure I fully understand everything I am posting -- for instance how was the first BAO detection made?
The talk was more fun than I expected, and has definitely eased my nerves in terms of my quals. I think I can use a similar version of this talk for my quals, which is good.

Saturday, August 13, 2011

SDSS-III Collaboration Meeting - Vanderbilt

Exciting results! Luminosity Dependent Clustering of Quasars. More details here.


Thursday, May 5, 2011

Masked BOSS and SDSS Data

Here are my photometric and spectroscopic data sets, masked so that they have the same footprint in the sky:

Whole Footprint (photometric)
Red = Data, Green = Randoms
Up-close patch (photometric)
Red = Data, Green = Randoms
Whole Footprint (spectroscopic)
Magenta = Data, Cyan = Randoms
Up-close patch (spectroscopic)
Magenta = Data, Cyan = Randoms
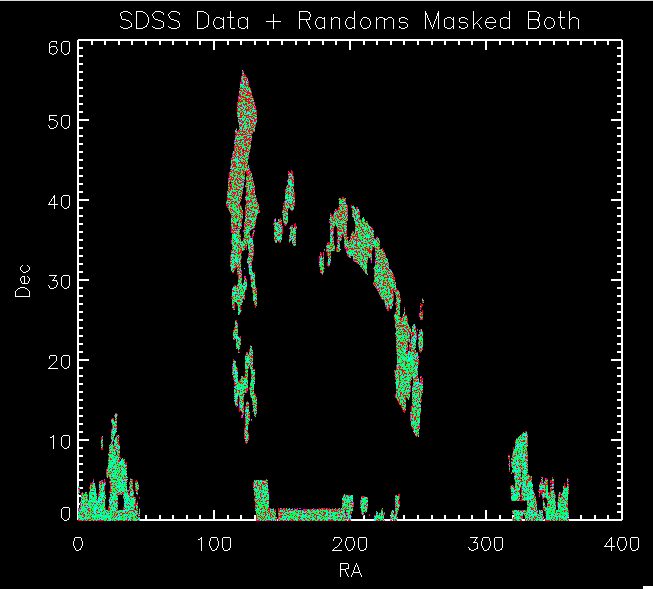
Whole Footprint (both)
Spectroscopic: Magenta = Data, Cyan = Randoms
Photometric: Red = Data, Green = Randoms
Up-close patch (both)
Spectroscopic: Magenta = Data, Cyan = Randoms
Photometric: Red = Data, Green = Randoms
Distribution of Dec (spectroscopic)
Magenta = Data, Cyan = Randoms
Distribution of Dec (photometric)
Red= Data, Green = Randoms
Distribution of Dec (both)
Spectroscopic: Magenta = Data, Cyan = Randoms
Photometric: Red = Data, Green = Randoms
Distribution of RA (spectroscopic)
Magenta = Data, Cyan = Random
Distribution of Dec (photometric)
Red= Data, Green = Randoms
Distribution of RA (both)
Spectroscopic: Magenta = Data, Cyan = Randoms
Photometric: Red = Data, Green = Randoms
Distribution of Redshift (z) (spectroscopic)
Magenta = Data, Cyan = Randoms
Distribution of Redshift (z)
Red = spectroscopic redshifts, Magenta = photometric photo-z's


Monday, March 21, 2011

Comparing Correlation Functions

I've been trying to figure out why my 2d Correlation Functions look weird. I've put out request to several Berkeley folks to compare my correlation function results on a data set with theirs, but while I wait for them to respond, I'm going to compare to some literature.

For the 2-d angular correlation function on SDSS LRG galaxies, I have the following plots from Connolly et al (2001):


And from Ross et al (2007):


I changed the angular bins of my correlation function to match these sets to try to form a comparison. Here is my 2D correlation function on BOSS data:

As you can see the slope of the function is much shallower for my correlation function, than it is the literature.

The 3D correlation functions are a better match:
From Ross et al (2007):

And here is mine:

At least the slopes seem to be comparable.

I am currently running the 3D correlation function on a larger los range to try to compare to Kazin et al. :

This will take a bit because I am correlating out to such large scales (180 Mpc/h).

Another thing I noticed that I wanted to talk to Alexia about is the actual computation of the correlation function in the code. Right now it is the following:

xi = (dd - dr - rd + rr)/rr

where

dd = # of data-data pairs in bin
dr = (# if data-random pairs in bin) / (Random Oversampling)
rd = (# if data-random pairs in bin) / (Random Oversampling)
rr = (# if random-random pairs in bin) / (Random Oversampling)

I am wondering if the rr should be divided by (random oversampling)^2 because there are that many more point in the RR set. I haven't changed this code from when I first got it from Alexia, so I assume it is correct. But I was looking the Landy, Szalay Paper and it seemed like they were using factors of n(n-1)/2 which is approximately n^2, and we are using factors of n.

Thoughts?

3/21 5:15 Update: Here is my plot of the 3d Correlation function on the large los range, it looks very similar to the Kazin plot above, you can even see the BAO signal @ ~100 Mpc/h:

Wednesday, March 16, 2011

Likelihood Paper

SDSS-III Publication 33: A Simple Likelihood Estimator for Quasar Target Selection

Authors:
Jessica A. Kirkpatrick (corresponding author)
David J. Schlegel, Nicholas P. Ross, Adam D. Myers, Joseph F. Hennawi

Abstract:
We present a new method for quasar target selection using a likelihood estimator. For our purposes we target quasars using Sloan Digital Sky Survey (SDSS) photometry to a magnitude limit of g=22. The efficiency and completeness of this technique is measured using Baryon Oscillation Spectroscopic Survey (BOSS) Commissioning Data, taken in late 2009. This technique was used as the CORE method for target selection for BOSS Year 1 spectroscopy to be realized in the 9th SDSS data release (DR9). When targeting at a density of 40 objects/deg2 we find the efficiency of this technique to be 41% and the completeness compared to all quasars identified in BOSS Commissioning Data to be 62%. This paper also describes possible extensions and improvements for this technique.

Comments:
SDSS-III participants have three weeks to send comments and to request changes. Participants comments should be sent to the Jessica Kirkpatrick.
The deadline to submit comments is Wednesday, April 6th 2011.

This is a BOSS science paper intended for submission to the Astrophysical Journal.

Downloads:
The most up to date .pdf of the paper can be found here:
likelihood paper (current) this version will be updated as I receive comments during the next three weeks.

The version of the paper submitted to the collaboration (3/16) is here:
likelihood collaboration submission

There is also a single column, double spaced version here (for easier editing):
likelihood paper one column

The .tex files and all associated figures, can be checked-out from the SVN at this location:
svn co svn+ssh://sdss3svn@sdss3.org/repo/boss/bosstarget/trunk/tex/likelihood/

Or downloaded here on the SDSS3 wiki.

Monday, November 1, 2010

Plot of Data / Randoms

Here is a plot of the data (cyan) and randoms (magenta) using the masks, and the method outlined in this post:


I'm a little confused as to why some of the data isn't represented in the randoms. It seems the mask is different than the data, perhaps this is because there is less completeness in the regions that aren't covered in the mask. I'll ask Shirley about this, but in the mean time, I'll apply the mask to both the data and the randoms, to insure the area covered are the same.


11/2 Update: Heard back from Shirley she says:

"This is deliberate. And your plot reflects it :)

There is a reason to cut out certain areas in the mask, and I never said that the data covers the same area as the mask :) ! I am testing things right now for different areas to cut out :) ! (due to extinction, stars and possible photometric calibration problems)"

So I looks like I should just apply the mask to both the data and the randoms before doing the cross correlation, as I suspected.

Friday, September 24, 2010

Bad Blogger

To the 3 people that actually read my blog (Alexia, mom and dad), I know I have been a really bad blogger lately. I've been writing a paper, and didn't have much to post about that... and then I was in Paris for a SDSS Collaboration meeting.

Anyway, the Fall 2010 semester has started (how did that happen?!?) and I plan to get back to regular posting. I also am hoping to work exclusively on the reconstruction project now that the likelihood paper is (almost) done.

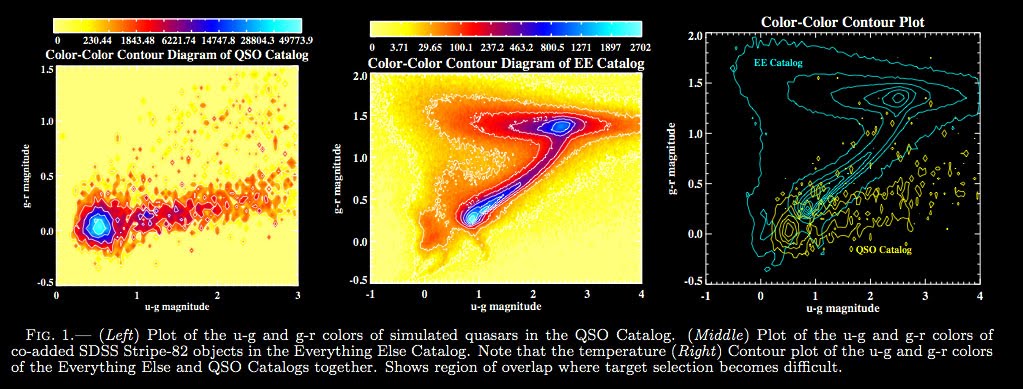
Apologies again. Here are some plots from the paper for your entertainment (the colors look a little less weird in black on white, but I inverted the images to keep with the blog color scheme):