Showing posts with label Joe Hennawi. Show all posts

Wednesday, March 16, 2011

Likelihood Paper

SDSS-III Publication 33: A Simple Likelihood Estimator for Quasar Target Selection

Authors:
Jessica A. Kirkpatrick (corresponding author)
David J. Schlegel, Nicholas P. Ross, Adam D. Myers, Joseph F. Hennawi

Abstract:
We present a new method for quasar target selection using a likelihood estimator. For our purposes we target quasars using Sloan Digital Sky Survey (SDSS) photometry to a magnitude limit of g=22. The efficiency and completeness of this technique is measured using Baryon Oscillation Spectroscopic Survey (BOSS) Commissioning Data, taken in late 2009. This technique was used as the CORE method for target selection for BOSS Year 1 spectroscopy to be realized in the 9th SDSS data release (DR9). When targeting at a density of 40 objects/deg2 we find the efficiency of this technique to be 41% and the completeness compared to all quasars identified in BOSS Commissioning Data to be 62%. This paper also describes possible extensions and improvements for this technique.

Comments:
SDSS-III participants have three weeks to send comments and to request changes. Participants comments should be sent to the Jessica Kirkpatrick.
The deadline to submit comments is Wednesday, April 6th 2011.

This is a BOSS science paper intended for submission to the Astrophysical Journal.

Downloads:
The most up to date .pdf of the paper can be found here:
likelihood paper (current) this version will be updated as I receive comments during the next three weeks.

The version of the paper submitted to the collaboration (3/16) is here:
likelihood collaboration submission

There is also a single column, double spaced version here (for easier editing):
likelihood paper one column

The .tex files and all associated figures, can be checked-out from the SVN at this location:
svn co svn+ssh://sdss3svn@sdss3.org/repo/boss/bosstarget/trunk/tex/likelihood/

Or downloaded here on the SDSS3 wiki.

Sunday, March 13, 2011

Unique Quasars

One of the comments from Hennawi about my paper was he wanted to know how many unique quasars were simulated in the QSO catalog.

I wasn't exactly sure how to define "unique" quasar.

The simulated i-band fluxes range from 15 to 22.5. They are simulated to 4 decimal places.
The simulated redshifts (z) range from 0.5 to 5.0. They are simulated out to 6 decimal places.

If I define unique to be the same out to the maximum decimal places provided, then there are only 2 simulated quasars that are repeats of each other (0.00002%)

If I define unique to be within 0.1% magnitude/redshift of each other, then there are 6285 (out of 10 million) are repeats (0.06%).

If I define unique to be within 1% magnitude/redshift of each other, then there are 62,824 repeat objects (0.6%).

Anyway, so I guess I should ask Joe how he wants me to define repeats.

Here is the code to do this:
file = '/clusterfs/riemann/raid001/jessica/boss/Likeli_QSO.fits.gz'
qsos = mrdfits(file, 1)

imean = mean(qsos.i_sim)
zmean = mean(qsos.z_sim)

percent = 1.0/100. #simulated quasars within this percentage of each other
ierr = imean*percent
zerr = zmean*percent

imult = round(1./ierr)*1.
zmult = round(1./zerr)*1.

roundqsosz = round(qsos.z_sim*zmult)/zmult
roundqsosi = round(qsos.i_sim*zmult)/imult

uniqz = uniq(roundqsosz)
uniqi = uniq(roundqsosi)

all = where(qsos.z_sim GT -99999)

repeatZ = setdifference(all, uniqz)
repeatI = setdifference(all, uniqI)

help, setintersection(repeatZ, repeatI)

Also can be found in the following log file:
../logs/110313log.pro

Monday, August 2, 2010

HRH07 LF

Joe has modified his code such that it now can run the Hopkins, Richards, Hernquist 2007 (HRH07) luminosity function. I have put this newest version of the code here on riemann:

/home/jessica/lumnew/

This code takes a pretty long time to run (8 hours) ...but here is what the luminosity function looks like:

Friday, July 30, 2010

HRH07 luminosity function

Joe,
I want to use the HRH07 luminosity function for the QSO Monte Carlo
for the likelihood. Back in May you told me that it would take you an
hour to get the code together and you would point me to it, but I
don't think you ever did.

I just need an equivalent file to:
/home/jhennawi/Projects/
QSOClustering/pro/k_correct/dNdz_qso_z0.5-5.0.dat

But using the HRH07 LF not the Jiang-Combo...

I know you are really busy, but I think you've already done this for
Extreme Convolution... and once I have this I can pretty much complete
likelihood testing and write this paper.

Thanks,
Jessica

Wednesday, May 12, 2010

ALL the Quasars

Recently Dinosaur Comics has been emphasizing ALL of everything. ALL the secrets, ALL the balls, ALL the burgers. So today we are going to creating the QSO catalog with ALL the Quasars.

Before we had a brightness limit and some other cuts, but Hennawi wanted me to see what it looked like with all of them.

I did this by modifying: qso_fake_jess.pro with the following call to qso_photosamp:
qsos = qso_photosamp(Z_MIN = Z_MIN, Z_MAX = Z_MAX, NOCUTS = NOCUTS, ILIM = 23.0)

Here is what these QSOs look like in color-color space:


And re-running hiz_kde_numerator_jess.pro:
.run hiz_kde_numerator_jess.pro

To create a new QSO Catalog:
../likelihood/qsocatalog/QSOCatalog-Wed-May-12-14:03:41-2010.fits

Here is what the QSO Catalog looks like in color-color space:


Change likelihood_compute to read in this catalog:
; Read in the QSO file
file2 = '/home/jessica/repository/ccpzcalib/Jessica/likelihood/qsocatalog/QSOCatalog-Wed-May-12-14:03:41-2010.fits'

This run is in the directory:
../likelihood/likev1all

The log file is here:
../logs/100512log.pro

~~~~~~~~

On a side note, I looked at Google Analytics for this blog today. It turns out that over it's lifetime 355 Absolute Unique vistors have viewed my blog! These visitors are from 10 countries and 28 different states. Pretty cool! Yet very few people leave comments on my blog. Everyone reading
this, leave a comment so I know you are out there!

~~~~~~~~

Is anyone else having problem's editing their blogspot blog using Google Chrome? It totally messes up the fonts and when I look at the html it is all funky. Seem strange considering google owns both Chrome and blogsplot! Maybe it is their way of punishing Mac users for the iPhone being better than the Google phone.

Thursday, May 6, 2010

Duplicates: The Bane of My Existance!

I am about ready to smash my fist through a wall. It turns out there were also duplicates in the quasar file.... here are the numbers/plots from yesterday with the quasar duplicates and target duplicates removed. Here's a cute piece of code to remove them (from Adam):

a = mdrfits('knownQSO+BOSS.fits',1) spherematch, a.ra, a.dec, a.ra, a.dec, 2./3600, m1, m2, maxmatch=0 dups = m1[where(m1 gt m2)] good = [indgen(n_elements(a))*0]+1 good[dups]=0 dupsremoved = a[where(good)] mwrfits,dupsremoved,'knownQSO+BOSS.nodup.fits',/create
And also code from Erin for removing BOSS duplicates:
targetplatefile = './targetallfile.fits'
targets= mrdfits(targetplatefile, 1)
pid = photoid(targets)
targets = targets[rem_dup(pid)]


Below are my new numbers (as compared to Adam's table) with a QSO redshift range 2.2 < z < 3.5:
                  Threshold         # QSOs per deg^2
20/deg^2 40/deg^2 20/deg^2 40/deg^2
Likelihood v1 0.7623 0.46035 7.14 10.85
Likelihood v2 0.2433 0.12765 8.09 10.64

If I use Myers' thresholds I get the following:
                  Threshold         # QSOs per deg^2
20/deg^2 40/deg^2 20/deg^2 40/deg^2
Likelihood v1 0.533 0.235 5.93 6.96
Likelihood v2 0.200 0.071 7.30 6.86

Adam get's the following numbers:
                  Threshold         # QSOs per deg^2
20/deg^2 40/deg^2 20/deg^2 40/deg^2
Likelihood v1 0.533 0.235 8.81 12.23
Likelihood v2 0.200 0.071 8.25 11.18

I suspect that Adam might be calculating the # per deg^2 taking the number of QSOs and dividing by 20/40. This doesn't seem right to me, because I am getting significantly different numbers of target fibers using these thresholds for the v1 vs v2 likelihoods (2848 for v1, 2060 for v2) and so simply dividing by 20/40 favors the old likelihood because we are giving more fibers to that version.

This is why I use:
# QSOs per deg^2 = # targeted QSOs / (total # targets / # per square degree)

There is also a question of changes in the distribution of likelihood ratio for the v1 vs v2. We would expect very different values for likelihood ratio because we are now modeling low/high redshift QSOs and adding them to the denominator, I am not sure if comparing these values tells us much. I think a more significant test is looking at the distribution of the redshift of the QSOs for v1 vs v2. We do seem to be targeting more low QSOs with the v2. This could possibly be corrected by implementing the McDonald score. I have the code to do this. Hennawi seems to think that the Richard's luminosity function doesn't work well at high redshifts. Now that I have removed the duplicates I need to re-test all the different luminosity functions again anyway. I can do this with and without the McDonald score for each luminosity function.

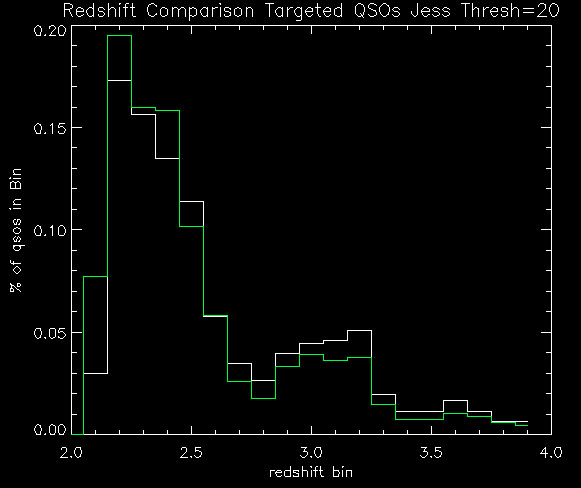
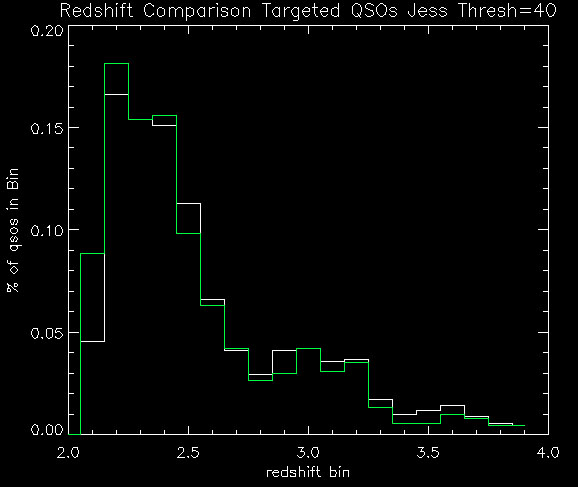
Below are plots (same as yesterday's post) + the likelihood ratio distributions. Again, white is v1 (old) and green is v2 (new):


Sunday, April 25, 2010

Likelihood Test Results (2)

I'm going to try adding in all QSOs (regardless of brightness). I've taken out the BOSS QSOs that are in Stripe-82 so that we don't have the same objects in the Monte Carlo as in the testing data.

Joe suggested doing this. We'll see if it improves things, if not, then looks like we should go back to old catalog and see if modifying the luminosity function helps.

Here is what they look like:
BOSS QSOs


SDSS DR5 QSOs


The code to do this is in the following log file: ../logs/100425log.pro
It creates the following file to use as input to Monte Carlo: ~/boss/allQSOMCInput.fits"

Plot of allQSOMCInput.fits


I re-ran hiz_kde_numerator_jess.pro to make a new QSOCatalog, which is here:
../likelihood/qsocatalog/QSOCatalog-Mon-Apr-26-13:22:43-2010.fits

Plot of QSOCatalog-Mon-Apr-26-13:22:43-2010.fits


I changed likelihood_compute to look at the above catalog.

Run the likelihood calculation with this new input catalog:

smalltargetfile = "./smalltarget.fits"
smalltargets = mrdfits(smalltargetfile, 1)

.com splittargets2.pro

nsplit = 50L
splitsize = floor(n_elements(smalltargets)*1.0/nsplit)
junk = splitTargets2(smalltargets, nsplit, splitsize)

; run likelihood.script

.com mergeLikelihoods.pro
likelihood = mergelikelihoods(nsplit)


outfile = "./likelihoods2.0-4.0ALLBOSSAddedSmall.fits"
splog, 'Writing file ', outfile
mwrfits, likelihood, outfile, /create


IDL> print, n_elements(ql) ; number quasars
467
IDL> print, n_elements(ql)*1.0/(n_elements(sl)+n_elements(ql)) ;percent accuracy
0.259300
IDL> print, n_elements(ql) + n_elements(sl) ; total targeted
1801
IDL>
IDL> print, n_elements(nql) ; number quasars
418
IDL> print, n_elements(nql)*1.0/(n_elements(nsl)+n_elements(nql)) ;percent accuracy
0.232093
IDL> print, n_elements(nql) + n_elements(nsl) ; total targeted
1801


This doesn't do better than the old likelihood either (same color scheme as last post).


The logfile for this is ../logs/100425log.pro

Friday, April 23, 2010

Running Likelihood Tests

I'm going to change one thing at a time here to figure out where the new likelihood goes awry. Unfortunately I didn't keep the best notes about how I changed the QSO catalogs before, and so I am finding it difficult to reproduce what I did. So I am going to be much better about documenting all the step here.

1. First I make a catalog of all the BOSS and otherwise known QSOs which aren't already in the inputs which we also have coadded fluxes by spherematching them with . The code to do this is in the following log file ../logs/100423log_1.pro. This makes a file: ~/boss/coaddedBOSSQSOs.fits which has the coadded fluxes (from varcat files) and redshifts of these QSOs. These fluxes are not de-reddened.

Here is a plot of these quasars


2. Combine this BOSS catalog with the SDSS DR5 "bright" quasars that are included in the old version of the Monte Carlo. This is done by running Joe Hennawi's qso_photosamp.pro program (to get the SDSS DR5 QSOs), reading in coaddedBOSSQSOs file, de-reddening them both, and then merging them into one file, which is then saved as ~/boss/brightQSOMCInput.fits. The code to do this is in the following log file ../logs/100423log_2.pro.

SDSS DR5 Quasars


brightQSOMCInput.fits QSOs


3. Change qso_fakephoto.pro to read in the ~/boss/brightQSOMCInput.fits file insteady of just running qso_photosamp.pro. Save this modified program as ../likelihood/qsocatalog/qso_fakephoto_jess.pro

4. Change hiz_kde_numerator.pro to call qso_fakephoto_jess.pro, instead of qso_fakephoto.pro and save as ../likelihood/qsocatalog/hiz_kde_numerator_jess.pro

5. Follow instructions from this post for how to change/create the luminosity function.

6. Enter the command :
.run hiz_kde_numerator_jess.pro into IDL to generate QSO Catalog.

7. Change likelihood_compute.pro so that it points to this QSO Catalog that you just generated as the input QSO Catalog:
; Read in the QSO
filefile2 = '/home/jessica/repository/ccpzcalib/Jessica/likelihood/qsocatalog/newCatalog.fits'

QSO Catalog (including the BOSS quasars)

Code to generate plots is in the log file: ../logs/100423_4log.pro

8. Make sure that the redshift ranges in likelihood_compute.pro match those in the file hiz_qso_dndz.pro.

Monday, April 19, 2010

Likelihood Improvements

On April 28th we need to submit the final version of the likelihood to the collaboration. I've been working on implementing changes and improvements to the likelihood. Here are the changes I've made thus far:

1. Changed luminosity function. I am currently using the Richards '06 luminosity function. Joe Hennawi thinks I should use a Hopkins, Richards, Hernquist (2007) combination function. I'm going to run on both and see which is better at targeting QSOs. See this post for more details.

2. Changed the redshift range of the QSO Catalog. Before we were only modeling QSOs from 2.0 < z < 3.9. Now we are modeling from 0.5 < z < 5.0. I need to optimize which range we should use for the numerator and which range we should use for the denominator. Nominally we are interested in targeting QSOs in the redshift range 2.15 < z < 3.5, so that is where I will start. Including low redshift QSOs in the denominator of the likelihood should improve the method significantly though.

3. Including BOSS QSOs along with SDSS DR5 QSOs with "good photometry." This fills out regions of the color/flux space which were clipped from SDSS such that we aren't missing QSOs which overlap with the horizontal branch stars. See this post for more details.

To speed up the computing of likelihoods, I am sub-sampling the low redshift QSOs (z > 2.1) by 10% and the high redshift (z < 2.1) by 50%. This reduces the number of objects in the QSO Catalog from 10,000,000 to 1,582,012. See this post for more details.

Joe Hennawi has some ideas for how to do this too which he outlined in an email today (see 4/20/2010 email subject: Likelihood weights):
Hi Guys,
After thinking about this more, and actually trying to work out the math, I convinced myself that indeed you were right. The factored probability I was proposing is not mathematically equivalent to the numerator which you are computing with the likelihood. Indeed, factoring the probability into p1(f_u/f_i/, f_g/f_i, f_r/f_i, f_z/f_i)*p2(f_i), is actually a more constrained model. This is however what we are doing with the extreme deconvolution, and for QSOs, this model is actually I think more desirable, for the following reason. Our model of QSO colors implicitly assumes that QSO colors do not depend on magnitude, and p1 reflects that behavior, whereas p2 is basically the magnitude prior. For stars, colors vary with magnitude. For extreme deconvolution, we had to fit to re-scaled fluxes (e.g. colors) rather than total fluxes in 5-d because gaussian models in general provide poor fits to power law distributions. This is also fine, since the color distributions of the stars vary so slowly with magnitude that you essentially make no errors by treating the probability as separable.

But this doesn't help too much with the current version of likelihood, since we don't plan to totally re-write that code. So I think the best approach would be to just take the entire list of QSOs that you plan to use, and re-scale them onto a grid of i-band fluxes spanning the range you want to consider, e.g. imin=17.8 -22.4. The grid spacing determines how finely you sample the i-band flux space, and this should be significantly smaller than the dispersion of QSO colors about the mean. Not sure what to choose here, but say you chose di = 0.01. Then your list of QSOs in the numerator would be a replication of that same list of QSOs N = (22.4-17.8)/0.01 = 460 times. Now in each i-magnitude bin, you can calculate the weights to apply to each QSO such that the weighted histogram of the QSO redshifts would give you the correct redshift and distribution and number of QSOs as predicted by the luminosity function.

I'm going to see how big of a difference it makes to calculate the likelihoods with my reduced catalog versus the full catalog (in terms of efficiency of selecting QSOs). Before I spend a bunch of time implementing Joe's suggestions.

Wednesday, March 17, 2010

Changing QSO Catalog Inputs

I'm trying to figure out how to modify the inputs (currently SDSS DR5 quasars with good photometry) into Joe's Monte Carlo. Here is what I have figured out so far (all the below files are on riemann):

hiz_kde_numerator.pro ;main program to generate the QSO Catalog
(calls) →
qso_fakephoto.pro ;generates simulated redshift and i-magnitude based on luminosity function and DR5 inputs
(calls) →
qso_photosamp.pro ;This generates the training set photometry
(calls) →
sdss_read_data.pro ;This reads in SDSS data it currently has the following 'DR5' call
qsos = sdss_read_data('DR5', Z_MIN = Z_MIN, Z_MAX = Z_MAX)

Here is a color-color redshift temperature plot of these DR5 QSOs:


I'm going to try to add in the BOSS QSOs with co-added photometry, especially in the redshift range z > 2.0 where we seem to be missing QSOs:


I found that there are 1,973 BOSS quasars that have a redshift above 2.0 for which we also have coadded photometry. Here they are plotted:


While it is a little more filled in in the u-g = 0.8 space, comparing it to all the BOSS quasars (regardless of how good their photometry is) below: