Showing posts with label mask. Show all posts

Thursday, May 5, 2011

Masked BOSS and SDSS Data

Here are my photometric and spectroscopic data sets, masked so that they have the same footprint in the sky:

Whole Footprint (photometric)
Red = Data, Green = Randoms
Up-close patch (photometric)
Red = Data, Green = Randoms
Whole Footprint (spectroscopic)
Magenta = Data, Cyan = Randoms
Up-close patch (spectroscopic)
Magenta = Data, Cyan = Randoms
Whole Footprint (both)
Spectroscopic: Magenta = Data, Cyan = Randoms
Photometric: Red = Data, Green = Randoms
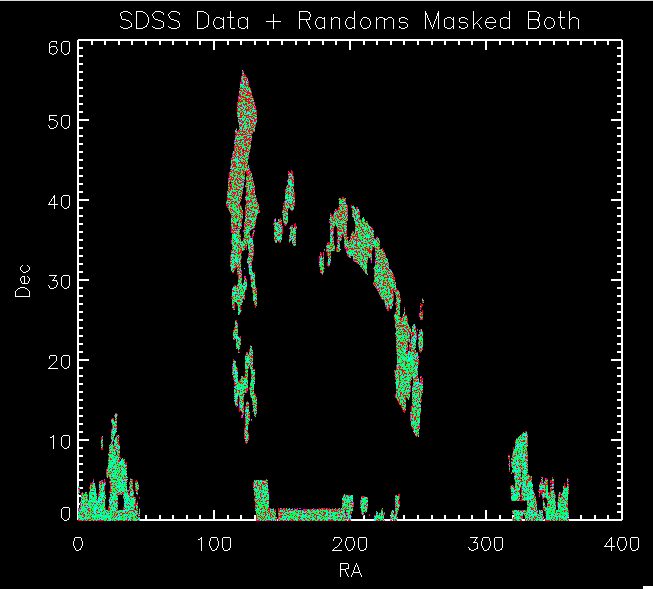
Up-close patch (both)
Spectroscopic: Magenta = Data, Cyan = Randoms
Photometric: Red = Data, Green = Randoms
Distribution of Dec (spectroscopic)
Magenta = Data, Cyan = Randoms
Distribution of Dec (photometric)
Red= Data, Green = Randoms
Distribution of Dec (both)
Spectroscopic: Magenta = Data, Cyan = Randoms
Photometric: Red = Data, Green = Randoms
Distribution of RA (spectroscopic)
Magenta = Data, Cyan = Random
Distribution of Dec (photometric)
Red= Data, Green = Randoms
Distribution of RA (both)
Spectroscopic: Magenta = Data, Cyan = Randoms
Photometric: Red = Data, Green = Randoms
Distribution of Redshift (z) (spectroscopic)
Magenta = Data, Cyan = Randoms
Distribution of Redshift (z)
Red = spectroscopic redshifts, Magenta = photometric photo-z's


Monday, March 7, 2011

About BOSS Data from Percival

Got word from Will Percival over the weekend:
He said the mask for the data/randoms is here:

https://trac.sdss3.org/browser/repo/boss/bosslss/trunk/geometry/current_boss_geometry.ply

He said:
I used the current_boss_geometry, choosing sectors with > 70% completeness. I don't have this separately in a file I'm afraid, but you could easily create it by placing the random catalog within the current_boss_geometry file - taking the quoted numbers as the completeness.

I said:
Thanks for the response. In terms of the 'current_boss_geometry' file. Is this as old as the randoms/galaxy files? Because I could imagine a scenario where the geometry file covers MORE area than the data files (because more of the sky has been observed) and then when I apply this "mask" to my other data it would let in regions of the sky which are not in the BOSS data files.

He said:
The current_boss_geometry file will always cover a larger area than that of the galaxies observed with completeness > 70%. But you can only use those polygons that contain one of the randoms. This will cut it back.

I said:
Also, how are you dealing with the spectroscopic completeness when generating the randoms? Are you basically filtering for each sky polygon based on the completeness in the current_boss_geometry file? For instance if a polygon has 80% completeness, then only 80% of randoms generated in that polygon are kept?

He said:
Yes, this is what I'm doing, based on the number of observed galaxies over the number of targets.

Wednesday, March 2, 2011

Mask Help From Martin White


Hi Jessica,

I don't remember exactly what I did to make the mask you're using, but those plots look more or less right, I'm not sure what you were keying on? In addition to dropping regions below 75% completeness I also threw away regions whose area was too small to reliably estimate a completeness -- that leads to small "gaps" in the mask. And the mask was made on the plates observed up until June (I think) last year and only included the higher z (CMASS) sample. Which part of the zoom in plot is worrying you? I assume that's the one you're worried about?

Of course, those files are very out of date now compared to the current situation and should probably be redone -- quite a lot has changed since then.

Martin.


~~~~~~~~
Martin,
The actual concern stems from the fact that the ra/dec distribution of the randoms I generate using this mask, do not match (within expected noise) to the distribution of the data. This caused me to wonder if perhaps I am applying the mask incorrectly. This is my first time working with mangle.

Here are plots of the masked data and masked randoms along with the distribution histograms. Note that both of these data sets have the same number of objects: 139874. In these plots the masked BOSS data is white and the masked randoms are green.

You'll notice that there are ra/dec regions where there are over densities of the randoms or the data much more than what you would expect due to Poisson noise. I've shown this by binning both roughly (50 bins) and finely (1000 bins). In the fine binning you can see what the noise levels are.


The way I am generating these randoms is as follows (code is at bottom of email):
1) Read in the BOSS Mask
2) Generate a set of random ra and dec values
3) Check if random ra/dec is in the mask
4) Cut set of randoms to only be items in side the mask
5) Get the polygon weight for each random in the mask
6) Generate a random "test weight" a value between 0 and 1 for each random.
7) If the "test weight" is less than or equal to the polygon weight for that random, keep the random.
8) Otherwise throw out the random. This assures that the completeness of the randoms matches that of the BOSS data.
9) Repeat above process until you get the desired number of randoms

I've talked to both David and Shirley about this and they seem to think this is the correct way to generate the randoms. So I am confused as to why the distributions don't match. I would think the clustering of the BOSS data would be on a smaller order than the bin sizes of the attached histograms.

Any insight you have on this problem would be wonderful.

Also, it would be useful to have a mask for the current BOSS data set, as you said the one I have is quite out of date. Is this mask continuously generated? Where could I download it? Or do you need to do it manually?

Thank you again for any ideas you have.
Jessica


Here is the code to generate the randoms:
; Read in BOSS Mask

bossmask = "/clusterfs/riemann/raid001/jessica/boss/bossX.002.ply"
read_mangle_polygons, bossmask, polygons, id

;Ignore mangle polygons where the pixel weight is zero
bosspolygons = polygons[where(polygons.weight GT 0)]

;Generate a set of random ra/dec:
randomdec = 90.0-acos(RANDOMU(S, 10*randomsize)*2.0-1.0)*180./!
p
randomra = RANDOMU(S, 10*randomsize)*360.

;Select objects in mask
results = is_in_window(ra=randomra,dec=randomdec,bosspolygons,in_polygon=polynum)
inBossMask = where(results EQ 1)
polys = polynum[inBossMask]

;Get weights of the randoms
randomweights = bosspolygons[polys].weight

;Cut the Ra/Dec such that it is in the BOSS Mask
rsra = randomra[inBossMask]
rsdec = randomdec[inBossMask]

; Keep or throw out a random based on the weight of the pixel it is generated in:
; Assign a random test weight, only keep randoms whose test weight
; is less than or equal to the weight of that pixel (randomweights).
; So if the weight of a pixel is 0.8 then 80% of randoms generated in that pixel will be kept.
weighttest = RANDOMU(S, n_elements(randomweights))
isobserved = where(weighttest LE randomweights)

;Randoms inside mask, weighted properly
randomra = rsra[isobserved]
randomdec = rsdec[isobserved]

thisra = randomra
thisdec = randomdec

(repeat until get the desired number of randoms)

----------

Jessica,

Ok, I'm not sure that I understand that and I don't know much (i.e. anything) about the IDL versions of Mangle routines. We can try a few spot tests quickly though. First, a more up-to-date mask. I don't have the latest mask (Will has taken over generating those) but I have one that's fairly close. I put it on Riemann in the BOSS subdirectory of my home directory:

/home/mwhite/BOSS/bossX.004.
ply

For that file I just generated a bunch of random points and asked what the polygon ID and weights were. See if your code agrees with this:

# RA DEC PolyID Weight
120.22085116 44.18548740 2395 0.8810
115.07126735 41.20294362 2276 0.0000
111.08122943 41.50788940 2458 0.9365
122.77802060 40.69059229 2520 0.9615
120.27949275 40.36484626 2501 0.8905
110.35797556 40.43283558 2453 0.0000
125.63829796 40.93875235 2542 0.9833
117.66991611 40.36353309 2324 0.7857
112.57187913 41.52219305 2452 0.9158
123.30608484 40.38555016 2522 0.9130

If you agree then I suspect everything is fine. If not, we can figure out what the differences are and try to fix them.

By the way ... there is a command ("ransack" I think) for generating random points which is part of the Mangle software package. And Will is supplying random catalogs now as part of his catalog efforts. They are available off the LSS pages on the BOSS Wiki.

Martin

-----

Martin,
Thank you for helping me debug this.

I get the same numbers as you below for polyID and weight. I guess I'll try using Will's random catalogs and see if that helps things.

I appreciate your time.
Jessica

----

Here is the code I used for the test:

testra = [120.22085116, 115.07126735, 111.08122943, 122.77802060, 120.27949275, 110.35797556, 125.63829796, 117.66991611, 112.57187913, 123.30608484]
testdec = [44.18548740, 41.20294362, 41.50788940, 40.69059229, 40.36484626, 40.43283558, 40.93875235, 40.36353309, 41.52219305, 40.38555016]
testpolyID = [2395, 2276, 2458, 2520, 2501, 2453, 2542, 2324, 2452, 2522]
testweight = [0.8810, 0.0000, 0.9365, 0.9615, 0.8905, 0.0000, 0.9833, 0.7857, 0.9158, 0.9130]

bossmask = "/clusterfs/riemann/raid001/jessica/boss/bossX.004.ply"
read_mangle_polygons, bossmask, polygons, id
results = is_in_window(ra=testra,dec=testdec,polygons,in_polygon=polynum)
weight = polygons[polynum].weight
polyID = id[polynum]

Monday, February 28, 2011

BOSS Mask Problem?

Below is an email I sent to Martin White today after Shirley, Nic and David couldn't figure out what I was doing wrong with my masks/randoms:

~~~~~~~~
Martin,
Back in December you generated a polygon mask for me for the BOSS data. I've been using this mask + BOSS data for my reconstruction project with Alexia and have gotten puzzling results when I compute correlation functions on the data.

This prompted me to look more closely at the way I was applying the mask to make sure I wasn't making a stupid mistake.

The BOSS data inside the mask (with weights greater than 0) looks very patchy up close, and both Ross and Schlegel think it shouldn't look like this.

I was wondering if you could look at the attached plots and see if you think the mask is being applied correctly.

MaskedBOSSDataAll.png shows the entire footprint. The blue points are galaxies in the spAll file that were outside the mask or have a weight = 0. The red points are galaxies in the spAll file that were inside the mask and have a weight GT 0.


MaskedBOSSDataClose.png shows a zoom into the region (35 < Dec < 55, 110 < RA < 130). The color scheme is the same as above. This shows the strange "patchy" nature of the masked data even in regions which seem to have been observed. I tried to use the same ra/dec range as Fig 3 from your paper (http://arxiv.org/PS_cache/arxiv/pdf/1010/1010.4915v2.pdf) for easy comparison.


One difference between my data and that in your plot is that the weights (completeness) of the red objects in my plots range from [0.75 to 1.0], whereas in your paper's plot they seem to range from [0 to 1.0]. Perhaps this is how you determined what is in the mask, if it had a spectroscopic completeness greater than 0.75?

If you have any insight into what I am doing wrong, that would be really helpful. Below is the IDL code I am using to apply the masks and generate the attached plots.

Thank you,
Jessica

;Here the code I used to apply the mask:
;Read in BOSS data
bossgalaxies = '/clusterfs/riemann/raid001/jessica/boss/spAll-v5_4_14.fits'
spall = mrdfits(bossgalaxies, 1)

;Trim to be a galaxy
isgal = where(spall.specprimary EQ 1 $
AND (spall.boss_target1 AND 2L^0+2L^1+2L^2+2L^3+2L^7) NE 0 $
AND strmatch(spall.class,'GALAXY*') $
AND spall.zwarning EQ 0)

;Select galaxies
galaxies = spall[isgal]
ra = galaxies.ra
dec = galaxies.dec
z = galaxies.z
spall = 0

bossmask = "/clusterfs/riemann/raid001/jessica/boss/bossX.002.ply"
read_mangle_polygons, bossmask, polygons, id
results = is_in_window(ra=ra,dec=dec,polygons,in_polygon=polynum)
inBossMask = where(results GT 0)
polys = polynum[inBossMask]
bossWeight = polygons[polys].weight
;Cut the Ra/Dec/z such that it is in the Shirley Mask
sra = ra[inBossMask]
sdec = dec[inBossMask]
sz = z[inBossMask]

;Here is the code I used to make the attached plots
;Plot Data that is inside the mask
window,xsize=700,ysize=600
xobject = sra
yobject = sdec
xtit = 'RA'
ytit = 'Dec'
mtit = 'SDSS BOSS Data w/ and w/o Mask'
plot, xobject, yobject, psym=3, symsize=2, xrange = [130,110], yrange=[35,55], XTITLE = xtit, YTITLE = ytit, TITLE = mtit, charsize = 2, charthick = 1, thick = 2, xthick=2, ythick=2
oplot, ra, dec, ps=3, color=fsc_color('blue')
thisweight = where(bossWeight GT 0)
oplot, xobject[thisWeight], yobject[thisWeight], ps=3, color=fsc_color('red')


plot, xobject, yobject, psym=3, symsize=2, xrange = [0,360], yrange=[0,60], XTITLE = xtit, YTITLE = ytit, TITLE = mtit, charsize = 2, charthick = 1, thick = 2, xthick=2, ythick=2
oplot, ra, dec, ps=3, color=fsc_color('blue')
thisweight = where(bossWeight GT 0)
oplot, xobject[thisWeight], yobject[thisWeight], ps=3, color=fsc_color('red')

Thursday, February 24, 2011

Figuring out Mask Problems

I re-made the random catalogs without removing the duplicates. David thought that perhaps this was causing problems with the randoms not matching the catalogs or the correlation functions not working properly.

Below are a bunch of histograms of the distribution of the data (white) and randoms (green) for the two methods I have tried for making randoms, mine and Shirley's. You'll notice that the spectroscopic randoms mismatch the spectroscopic data much more than the photometric data/randoms (for both methods). This makes me perhaps think there is a problem with the mask I am using for the spectroscopic set. Martin White made this mask for me.. I've ask for a meeting with David this afternoon to look at this in more detail.

My randoms


Shirley's Randoms


I've tried zooming in on regions in the data where the mismatch is greatest. For instance ( dec > 40, 110 < ra < 130). I've posted these on the blog too.

It does look like there are regions where there are data and not randoms, which would suggest a problem with the mask. (Note that the regular spacing of the randoms is because this is how Shirley generates randoms, by putting an object in the center of the grid). I plotted these because it is easier to see with the regular spacing that regions have been missed. For instance at ra ~129.4, dec ~ 49.4, There are several data points (red), but but randoms (blue). You can click on the below pictures to make them bigger.


Tuesday, December 14, 2010

Making Randoms within Mask

I spent the weekend trying to make random catalogs inside the masks. They are taking forever to run, so I probably need to optimize better. I didn't spend too much time doing this before because I figured we would only need to make the random catalogs once and then we could just use them over and over again.

However, I've been running the code to generate them for > 13 hours and they still haven't finished, so there is a problem somewhere. The issue is that the mask represents a small region of the sky, but I am generating random objects over the whole sky, so 99.99% of the objects are rejected and thus the code is very inefficient.

Update: I found a bug in this code while trying to optimize explains why it was taking so long to run. Here is some testing about how it scales with number of randoms generated:

photo randoms:
500 randoms
Mon Dec 13 22:28:44 2010
Mon Dec 13 22:29:13 2010
29 seconds

5000 randoms
Mon Dec 13 22:34:00 2010
Mon Dec 13 22:31:02 2010
~3 minutes

50,000 randoms
Mon Dec 13 22:36:04 2010
Mon Dec 13 23:02:00 2010
~28 minutes

spectro randoms:
500 randoms
Mon Dec 13 22:32:10 2010
Mon Dec 13 22:31:45 2010
25 seconds

5000 randoms
Mon Dec 13 22:37:06 2010
Mon Dec 13 22:34:38 2010
~2.5 minutes

50,000 randoms
Mon Dec 13 22:38:51 2010
Mon Dec 13 23:01:42 2010
~23 minutes

The way the code works in it's current (inefficient) form:

For Spectroscopic Data:
1) Read in the two masks.
2) Create random ra and dec that are 5X as big as the spectro data set
3) Assign a redshift from the redshifts of the spectro data set (to keep same redshift distribution)
4) See if ra/dec is in the both masks
5) If it is in both masks, look at the weight in the BOSS mask. Assign a random weight to the object (between 0 and 1), if it is less than or equal to the weight of the BOSS mask then it is "observed", if it is greater than the BOSS weight it "isn't observed"
6) Repeat above until you reached the right number of randoms

For Photometric Data:
1) Read in the two masks.
2) Create random ra and dec that are 5X as big as the photo data set
3) See if ra/dec is in the both masks
4) Repeat above until you reached the right number of randoms

We don't need to assign a redshift to the photo data or "observe or not observe" because the photometric data doesn't have weights.

The code is here:

../pcode/photorandoms.pro
../pcode/spectrorandoms.pro

The code to run this as a qsub is here:
../pcode/makeRphoto.script
../pcode/makeRspec.script

You run it with the following code:
qsub makeR[photo,spec].script

The randoms have the same distribution as the data, shown in the following histograms, white is the data, red is the randoms:


Sweet!

Friday, December 10, 2010

Using the Whole Footprint with Masks

For the past few days I've been working on using masks to run correlation functions on the whole BOSS footprint. It's required learning how to use polygon masks and also to create randoms in these masks. Here is the code/testing:

To mask BOSS data (spectroscopic set)

;Read in BOSS data
bossgalaxies = '/home/jessica/boss/spAll-v5_4_14.fits'
spall = mrdfits(bossgalaxies, 1)

;Trim BOSS data to be a galaxy (remove QSOs, starts, etc)
isgal = where(spall.specprimary EQ 1 $
AND (spall.boss_target1 AND 2L^0+2L^1+2L^2+2L^3+2L^7) NE 0 $
AND strmatch(spall.class,'GALAXY*') $
AND spall.zwarning EQ 0)

;Select galaxies
galaxies = spall[isgal]
ra = galaxies.ra
dec = galaxies.dec
z = galaxies.z

;Select objects in the masks
weights = maskdataboth(ra,dec,z)

; Readout ra, dec, redshift of spectroscopic objects inside mask
thisfile = '/home/jessica/boss/spectroRaDecZMasked.dat'
writecol,thisfile,ra,dec,z

The code for maskdataboth is here:
/home/jessica/repository/ccpzcalib/Jessica/pythonJess/maskdataboth.pro

'maskdataboth' filters the data through both the BOSS mask and Shirley's mask to make sure the data sets are in the same ra/dec footprint.


To Mask Shirley's Data (photometric set)

;Read in Shirley's Photometric Data
file1 = "/home/shirleyho/research/SDSS_PK/powerspec_dir/DATA/ra_dec_z_run_rerun_camcol.z_gt_0.01"
readcol, file1, pra, pdec, pz, RUN, rerun, camcol, x, x, x, x, x, x, x, x, format='(F,F,F,D,D,D,D,D,F,F,F,F,F,F)'

;Select objects in the masks
pweights = maskdataboth(pra,pdec,pz)

; Readout ra, dec, redshift of spectroscopic objects inside mask
thisfile = '/home/jessica/boss/photoRaDecZMasked.dat'
writecol,thisfile,pra,pdec,pz

Here are plots of the data sets to show that they do indeed fall in the same region of the sky:


Both these data sets are saved in the following directory: /home/jessica/boss/
The code to run this is here: ../logs/101210log.pro

Thursday, December 9, 2010

Tuesday, November 2, 2010

Masking both Data and Randoms

I've masked both the data and the randoms now:


The randoms (magenta) now fall exactly on top of the data (cyan). The code to do this is as follows:

;Read in data
file1 = "/home/shirleyho/research/SDSS_PK/powerspec_dir/DATA/ra_dec_z_run_rerun_camcol.z_gt_0.01"

readcol, file1, RA, DEC, z, RUN, rerun, camcol, x, x, x, x, x, x, x, x, format='(F,F,F,D,D,D,D,D,F,F,F,F,F,F)'

datasize = n_elements(ra)

;Read in mask
file = "/home/shirleyho/research/SDSS_PK/powerspec_dir/MASK_SDSS/dir_fits/tmp_unified_score_ebv_psf_bsm_nside1024.fits"

read_fits_map, file, weight, nside=nside_in, ordering=order


index = 0L
;Convert ra/dec to phi/theta expected in HEALPix
dataphi = ra*!pi/180.
datatheta = (90.0-dec)*!pi/180.
;Will be filled in with weight corresponding to ra/dec of data
dataweight = findgen(datasize)*0.0

;Function I wrote to get the weight for the data
junk = maskdata(datatheta, dataphi, index, datasize, nside_in, weight, dataweight)
;Only keeps data with a weight greater than 0.2 (inside mask)
datacut = where(dataweight GE 0.2)

;Make the randoms
randomsize = datasize*5L
randomtheta = findgen(randomsize)*0.0
randomphi = findgen(randomsize)*0.0
index = 0L
;Function I wrote to fill in randomtheta and randomphi with points inside the mask
junk = makemaskrandoms(randomtheta, randomphi, index, randomsize, nside_in, weight)

;Plot the data and the randoms
plot, ra[sub], dec[sub], psym=3, symsize=2, xr=[0,360],yr=[0,90], XTITLE = "RA", YTITLE = "DEC", TITLE = "RA vs Dec of Data and Randoms", charsize = 2, charthick = 1, thick = 2, xthick=2, ythick=2
oplot, ra[datacut], dec[datacut], psym=3, color=fsc_color('cyan')
oplot, randomra[0:100000], randomdec[0:100000], psy = 3, color=fsc_color('magenta')

Now to compute some correlation functions!

Monday, November 1, 2010

Plot of Data / Randoms

Here is a plot of the data (cyan) and randoms (magenta) using the masks, and the method outlined in this post:


I'm a little confused as to why some of the data isn't represented in the randoms. It seems the mask is different than the data, perhaps this is because there is less completeness in the regions that aren't covered in the mask. I'll ask Shirley about this, but in the mean time, I'll apply the mask to both the data and the randoms, to insure the area covered are the same.


11/2 Update: Heard back from Shirley she says:

"This is deliberate. And your plot reflects it :)

There is a reason to cut out certain areas in the mask, and I never said that the data covers the same area as the mask :) ! I am testing things right now for different areas to cut out :) ! (due to extinction, stars and possible photometric calibration problems)"

So I looks like I should just apply the mask to both the data and the randoms before doing the cross correlation, as I suspected.

Monday, October 25, 2010

Code for Random Catalog with Mask

From Wolfram Math World:


To pick a random point on the surface of a sphere, it is incorrect to select spherical coordinates θ and φ from uniform distributions θ ∈ [0,2π) and φ ∈ [0,π], since the area element dΩ=sinφdθdφ is a function of φ, and hence points picked in this way will be "bunched" near the poles (left figure above).

To obtain points such that any small area on the sphere is expected to contain the same number of points (right figure above), choose u and v to be random variates on (0,1). Then

θ = 2πu

φ = cos-1(2v - 1)

gives the spherical coordinates for a set of points which are uniformly distributed over the surface of the sphere. This works since the differential element of solid angle is given by

dΩ = sinφdθdφ = -dθd(cosφ)

So for us to pick a random ra and dec on the sphere we want to use the following in idl:

theta = 2*!pi*RANDOMU(S, 1)
phi = acos(2*RANDOMU(S, 1) - 1)

This should give us a random theta and phi where θ ∈ [0,2π) and φ ∈ [0,π].

Unfortunately, just to be difficult HEALPix expects the following as inputs for ang2pix_nest:

theta - angle (along meridian), in [0,Pi], theta=0 : north pole
phi - angle (along parallel), in [0,2*Pi]

So their convention is the opposite of mine above so we should use the following:
phi = 2*!pi*RANDOMU(S, 1)
theta = acos(2*RANDOMU(S, 1) - 1)

Here is the code:

file = "maskfile.fits"
; nside_in is the number of pixels n the mask
read_fits_map, file, weight, nside=nside_in, ordering=order

; make random phi and theta
phi = 2*!pi*RANDOMU(S, 1)
theta = acos(2*RANDOMU(S, 1) - 1)

; Find pixel ipnest
ang2pix_nest, nside_in, theta, phi, ipnest

; Find weight of pixel
thisweight = weight[ipnest]

; check to make sure pixel center (thistheta, thisphi) is close to phi and theta
pix2ang_nest, nside_in, ipnest, thistheta, thisphi

(Checked this for several theta/phi and it looked good)


So here is the code to make the random catalog of size randomsize:

randomsize = 100
randomtheta = findgen(randomsize)*0.0
randomphi = findgen(randomsize)*0
index = 0

while index lt randomsize do begin
thisindex = index
while index eq thisindex do begin
phi = 2*!pi*RANDOMU(S, 1)
theta = acos(2*RANDOMU(S, 1) - 1)
ang2pix_nest, nside_in, theta, phi, ipnest
thisweight = weight[ipnest]
if thisweight gt 2.0 then begin
randomtheta[index] = theta
randomphi[index] = phi
index = index+1
endif
endwhile
endwhile

Monday, October 18, 2010

Learning About HEALPix

I've been playing with Shirley's LRG catalog and mask. The mask uses something called HEALPix which I've never used before. It basically breaks up the spherical sky into equal area pixels:


The map is in the form of weights for each pixel. Shirley says that if the weight is greater than 0.2 she considers that pixel in the mask.

So to create a random catalog, I just go through the weights, and if it is greater than 0.2 I place objects in that pixel.

The key is to now convert from a Healpix mask to ra/dec.
There are two routines that do this that I have found:

DPF_PIX2ANG_NEST
pix2ang_nest

The problem is that these routines return the ra/dec of the center of the pixel. And to avoid putting extra power at the separations of the pixels, we want to select random points within the pixel. However, as you can see below, the ra range of these pixels changes dramatically as a function of cos (theta) (i.e. large at the poles and small at the equator) and so it isn't a simple procedure to fill in the area of a pixel evenly with random points:


I've searched to see if there is an existing package that does this, and I can't seem to find anything. In the HEALPix documentation there is a comment on random number generation, it doesn't seem to be what I am interested in here. I also have a email out to Shirley about this.

There are many functions that deal with HEALPix on their web page and well as in IDLUTILS. I'm currently combing through them to see if there is a function that gives me the ra/dec ranges for a given pixel, or even better, automatically picks a random point given a pixel.

Some questions:
  1. How do I assign a random place in a HEALPix pixel and convert this to a ra/dec position?
  2. The mask contains a "weight" for each HEALPix pixel, how to do factor in the weight into the random catalog. My intuition is that pixel's with higher weight should have more objects in them, but will this add clustering signal to the random catalog that we don't want?
  3. How do we distinguish what is signal because of observation effects (we only looked at that patch of the sky once, or we didn't target as many objects there) and what is signal due to clustering of the data (there is a huge galaxy cluster in that part of the sky, and that is why there is more data there)?

Friday, March 26, 2010

Mask Fixed

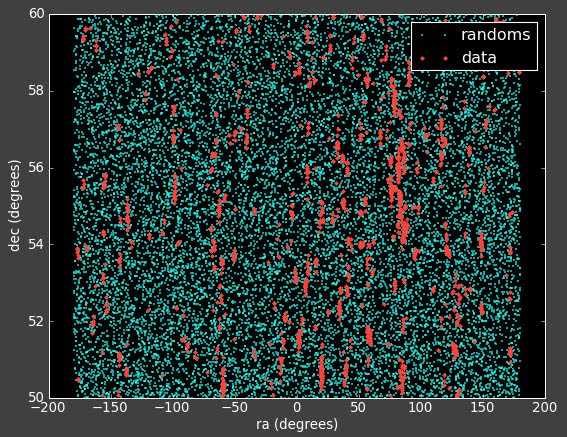
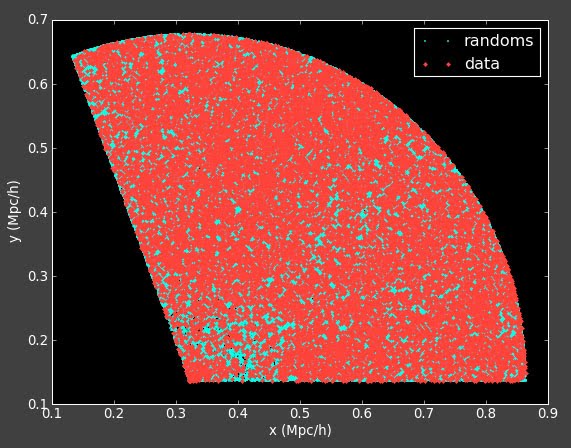
It turns out that my mask was messing up. I now have it fixed. Here is what the data/randoms look like on the mock data:


And here is what is looks like for real data:


The log on 3/29 has the code to run these.