Showing posts with label Newman Method. Show all posts

Thursday, January 21, 2010

Success!

I finally got Alexia's new crl working. As far as I can tell the only difference is that getximat expects the errors in xi as an input. For now I am just inputting an identity matrix, as I will need to get the errors by bootstrapping and haven't done that yet.

The function getximat wants a matrix that is the same size as the length of the xiss matrix:
xierr = N.identity(xispec.shape[1],float)

I am reconstructing from 0 to 0.5 Gpc/h using 20 bins. I am renormalizing the reconstructed redshift distribution by the following:
sum(photometric data)/sum(reconstructed data)
This gives the same "number" of objects in both sets.

This is the first reasonable reconstruction I have ever generated. This makes me very very happy. I'm going to play with different binning and selection functions next, but I would like to have at least one blog entry which has a happy ending.

Tuesday, January 19, 2010

Back to Work (back to Reconstruction)

I need to do a better job of balancing working on both the Newman Project and BOSS Likelihood target selection. I feel like it's been months since I have worked on the Newman stuff. Luckily Alexia was in Mexico and helped me get up to speed again.

Martin White gave me a halo mock catalog (I was using the wrong one for a while) and I have applied the following selection function to the photometric data set:


This corresponds to the following redshift distribution (phi):

The blue line is a histogram of the redshifts of the mock data, and the green line is the phi we are imposing (by both geometry and the selection function, you can see they match pretty well). I believe the difference in these two is based on actual structure, not an problem with implementing the selection function.

On the spectroscopic data, I imposed no selection function, and so the distribution was based purely on the geometry and structure of the data. Because the geometry is a sphere, we expect more objects at greater redshifts (larger volume at greater r):


I decided to start with a small run with data sets of approximately equal size. The photometric data set has 25,887 objects, and the spectroscopic data set has 25,470 objects. The redshift bins are 50 Mpc/h wide and go from 0 - 500 Mpc/h. Here are the 2D cross-correlation functions and the 3D auto-correlation functions of the mock data:


Here is the reconstruction. It is using an old version of crl (I'm having trouble downloading the newest version from the repository). It doesn't seem to be doing that good of a job reconstructing:


Maybe updating crl will help things? Thoughts Alexia?

Monday, January 18, 2010

Notes from the Beach

I have spent the last two weeks at two conferences. First the American Astronomical Society (AAS) 215th Meeting in Washington DC, second Essential Cosmology for the Next Generation: Cosmology on the Beach in Playa del Carmen, Mexico. Both were really helpful for both learning new astrophysics, as well as getting lots of new ideas for my work.

I thought I would summarize here the highlights (with links to talks, and a list of things I would like to look into myself).

Max Tegmark coined the phrase "Goldilocks Galaxies" when talking about the Luminous Red Galaxies (LRGs) in SDSS. This is because "Quasars are too sparse, common galaxies are too dense, but LRGs are just right."

Mark also talked about 21 cm tomography comparing it to the CMB in it's potential importance to cosmology. His description unfortunately was pretty general and I don't think I understand how it works. Need to read a review paper on this. Looks like this might be a good one.

Nicholas Suntzeff had an interesting slide at the end of his talk where he gave advice to young cosmologists about how to be competitive for jobs. I've repeated it below:
  • Don’t keep on doing your thesis over and over again
  • Establish prominent collaborators and mentors, but appear independent
  • Publish, publish, publish. Include useful tables of summary and colorful figures that can be easily captured.
  • Apply for external funding
  • Luck verus hard work
  • Become the leader in your field
  • Think carefully about joining large projects with time scales of > 5 years.
  • Spergel’s law
  • Don’t be afraid to go out on a limb and say something weird (people will remember you).
  • The Aaronson effect in obsevations.
  • When you apply for jobs, make sure you know all about the department – and brown nose a bit. Write your application as if there is no other job out there. Know your audience.

Berian James is a new post-doc at the BCCP starting this spring. He had some ideas about Newman project and had talked to others who are working on similar things (he named John Peacock and Hannah Parkinson at Edinburgh). He also had an interesting idea that it would be great if we could positions from photometry and a redshift distribution and generate a correlation function from these two things. He was wondering if anyone has done this. I should talk to him more about this when he gets to Berkeley.

Dovi Poznanski suggested I look at quasar variability using overlapping Sloan plates. Apparently 20% of the data has multiple epochs. Josh Bloom also told us that we could get good variability information using Palomar data. Nic Ross and I should set up a meeting with him when we get back.

Daniel Matthews is Jeff Newman's graduate student. He presented a poster at the AAS (see Jan 2nd email, subject: poster, he sent me a copy). In this poster he talked about doing redshift distribution reconstructions of "DEEP-like" data. He does something different than what Newman does in his paper. He claimed that he couldn't get Newman's method to work -- this is discouraging. Maybe it's time to try to talk to Newman directly about the project to clarify this?

The Joe Wolf Effect.

Marilena LoVerde discussed lensing of quasars from hydrogen in the ly-alpha forest. I talked to her afterwards and it doesn't seem like this effect his that large, but might be relevant for BOSS/BIG BOSS. The talk isn't posted on the Cosmology on the Beach web page as of right now.

Eyal Kazin has a web page with LRG catalogs. He said he is interested in the Newman Project and is very familiar with SDSS data, and to contact him if we want help. These LRGs might be useful data to use instead of the ones I downloaded from CAS, and don't really trust.

I had some thoughts about if I should request authorship on future DRIFT analysis papers, considering they didn't allow me to publish my work. I don't know what the protocol for this type of thing is, or if it even matters at this point in my career.


I had a great time at these conferences and learned a lot. Time to get back to real work now! Science to follow....

Friday, October 9, 2009

Talking with Weinberg

I ran into David Weinberg at tea at the IAS today. We started talking about the Newman Project.
He suggested that after we get the method working on Stripe 82 using the LRGs as our "spectroscopic sample" and the rest of the galaxies as our "photometric sample" we could compare the reconstructed distribution with spectroscopic "follow-up" surveys such as COSMOS, Vimas?, and DEEP.

Then it would be interesting to break down the main sample (i.e. the rest of the galaxies) by colors and do redshift distribution reconstruction on each type of galaxy. We could also break these into photometric redshift slices and then look at the reconstruction in each slice and break those down by colors, to see if perhaps there is a different spread in the colors.

I thought these were really good ideas and ones that I haven't though of before. Need to talk to Schlegel/Nikhil and see what they think. Oh exciting!

Working Mask

After banging my head against the wall for an hour (and talking to Alexia) I figured out the problem with my mask/conversion from yesterday. I was using a definition I found here to do the conversion from ra, dec, redshift to x, y, z for the Sloan data. However on the mock data, I was using a simple coordinate change from spherical to Cartesian as found in most physics text books like here. This was because I don't actually need to get redshifts (we want ra, dec and comoving distance) and therefore the conversion is less complicated. I had changed this function in my python code, but not in the correlation function code (which is in C) and so one set of code was doing one conversion and the other was doing something different.

I also had an issue that I was putting the data into a box of dimensions 1x1x1 (because this is what the correlation function was expecting) but had forgotten to do the same thing to the randoms. This is probably what was causing the correlation function to be way off.

I have corrected both these problem, and now my random data falls in the same region as my masked data. Woo hoo!


The correlation function matches (sort of), there seems to be an issue with the boxsides matching up, I need to figure this out:


If I divide my correlation function binning by the size of my box then they match up pretty well. I think this comes down to the fact that Alexia's code thinks the boxside is 1Mpc, and my code thinks the boxside is ~1000Mpc, I need to fix this in the code itself, but for now this makes me happy that they seem to match up well:


Remaining Problems/To dos:
  • You'll notice that the random data has negative values. This is probably due to the randoms covering a slightly larger area than the actual data, and thus when I try to fit it into a 1X1X1 box (which sides are determined by the actual data) it spills out slightly and thus goes slightly negative. This will cause problems when calculating the correlation function because the calculation expects the data to be in a 1X1X1 box which goes from 0 to 1. I need to fix this in both the randoms and the data, perhaps by shifting them both slightly?
  • The x-axis of the correlation functions aren't matching, this is probably due to different versions of the code thinking the size of the box is different. This needs to be corrected.
  • I am currently populating the random redshifts uniformly within the redshift range. However, because the density of objects evolves with redshift, I should actually be populating the random data with the same redshift function as the data. I had this implemented in an older version of the code, but it was never tested, so now I need to add that back into the code here.

Thursday, October 8, 2009

Very Confused

I am back to working on the Newman project. I decided to follow my idea from Bad Blogger posting and take a chunk of mock data and apply a mask in ra, dec, and comoving distance and then convert that data into x, y, z and feed it into my code (which is what I will be doing with the Sloan data).

Here is my masked data:

ra and dec mask

ra and comoving distance mask

These masks are funny shapes in x, y, and z (as to be expected):

Because the data is contiguous in ra, dec, comoving coordinates, I make the randoms in these coordinates and when I plot the data and the randoms you can see they fall int he same regions:


However when I translate these randoms into Cartesian coordinates -- using the same algorithm I used to create the data -- I get the following problem:


This is very confusing to me. I must be doing something wrong in the conversion, but I've checked this several times, so I don't know why it would be different now. AAAAAAAHHHHH.

Thursday, October 1, 2009

Ideas from Talking with Eric

I had a talk with Eric Huff today about the Newman Project. He is interested in possibly using a similar technique on background galaxies, and foreground reconstructed mass distribution (from weak lensing) and then using these two sets as the "photometric" and "spectroscopic" data sets, as a possible way to perhaps dig out errors in your redshift distribution of the background galaxies. It is an interesting idea, however because the two sets do not overlap in redshift space I am not sure if we can do this.

He also was asking about some way to use the photo-z information of the objects in my photometric data in this method, to somehow improve on the photo-zs instead of disregarding that information entirely. I was thinking that perhaps we could use the photoz information in the binning somehow. Or take the photo-z distribution as a starting place for reconstruction. This might be something to think about if the reconstruction continues to not work on it's own.

Wednesday, August 12, 2009

Tools of the Trade

I've found some useful tools for blog writing when you are trying to insert equations and images.
~~~~~

I talked with Eric Gawiser today. He has thought a bit about the Newman method and had some good suggestions for me. He suggested that we would expect bias to be a function of redshift in the Sloan data set, and therefore we would have trouble properly normalizing our reconstruction because it would be the actual redshift distribution convolved with the bias function. He said that perhaps we could get a handle on the bias as a function of redshift by doing a 3D-autocorrelation function on the photometric data. I am not sure if this is already taken into account with the reconstruction or if the reconstruction is assuming a constant bias over redshift bins. This is something I need to talk to Alexia about. Nonetheless, Eric seems to know a lot about this and would be a good person to keep talking to about it.

~~~~~

I talked to David about the SVM-Light package. He seemed not so enthused. He said he wanted me to work out some other problems before I moved on to "code optimization." We went over how they ended up doing the selection on the QSOs using the likelihood method. He wants me to work out the normalization of the likelihood function so that the numbers actually mean something logical. He also isn't convinced that the MMT data is actually what we think it is. Apparently the method was only 75% complete with a 40% efficiency, so that isn't good. He wants me to get to the bottom of this and see if the QSO objects in the MMT data are actually quasars by comparing with Robert daSilva's variability catalogues. He also wants to check how good the method works on single-epoch data (they were running it on the co-added photometry).

He suggested that perhaps I run Michael Blanton's photo-z code on the Stripe-82 co-adds and use that at my data set for the Newman project. He suspects the photo-z's will be better than the single epoch data. He also suggested that perhaps a reason why my 3D correlation functions look so weird is because we get fiber collisions which wipe out correlations and ~Mpc scales (depending on redshift). Another reason to perhaps try this on mock data before I debug for years trying to find an error in my code (it's possible this method just wont work on this data set).

~~~~~

I gave the link to this blog to Alexia, and posted it on Facebook. I am fulfilling the whole "being accountable to people" rule. I guess I should change the blog's privacy settings so it is Google-able [DONE], and perhaps should add a link to my webpage. I hate the idea of people actually reading this (not that I think I am that important).

Tuesday, August 11, 2009

Deconstruction

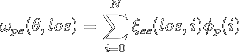
The basic idea of the Newman Method redshift distribution reconstruction code is to take two sets of data which overlap in sky position (ra, dec). One set (let's call it S) is spectroscopic data where we have known redshifts. The other set (P) is photometric data where we do not know the redshifts (or at least don't know them very accurately). Next, I bin S into line of sight (los) distance bins. In the example I am describing here I have binned S from 200 Mpc/h to 1400 Mpc/h with a bin width of 200 Mpc/h. Then we take the angular correlation function, ω(los,θ), [see Landy, Szalay (1993) and Masjedi et al. (2006) for definitions of correlation functions] between each of these binned subsets of S and P. We then take the 3D auto-correlation, ξ(r) of the binned S with itself. The redshift distribution, φ, of P can be reconstructed by inverting the following sum over N bins:
ref: Schulz and White in Prep.

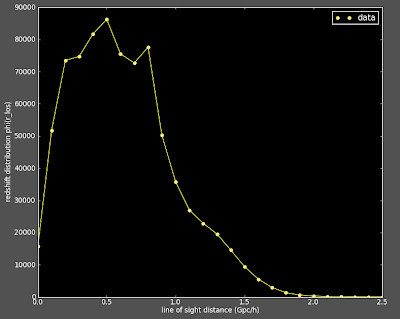
I am applying this method to galaxies in the Sloan data set. Here is what I expect the reconstructed redshift distribution to be (based on the photo-z's of the photometric data):

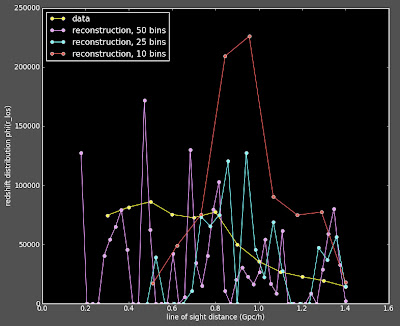
However when I run the reconstruction code, I get answers which do not look anything like this redshift distribution. More disturbing is that I get answer which vary wildly depending on how many φ bins I use in the reconstruction (which makes no sense at all to me). See below plot:


Alexia thinks that perhaps there is something wrong with my 3D-correlation function (it looks pretty featureless and smooth). So the next step is to try different binning of ξ(r) to see if perhaps this allows for better reconstruction -- maybe I am using too many bins and this is causing problems because the correlation function doesn't work properly if it doesn't have enough objects to reconstruct? David suggested that I try running my code on a set of mock data where we know the answer (and we've gotten the code to work before on this data). This will help me separate out if this is a issue with my version of the code, with the data (I am using photometric data and pretending that the photo-z's are the actual redshifts, which may not be good enough), or with the Newman method itself.

Monday, August 10, 2009

Lost in Translation

I've been having this problem that when I run my 3D auto-correlation function code on my laptop it runs fine, and gives me a logical result, but when I run the same code on my LBNL machine (riemann, for those who are familiar) I get a Segmentation fault and the code crashes. The code has the same inputs for both machines. The scarier thing is that when I run the code on a file with more data points, it doesn't crash on either machine.

However, I'm supposed to write about research accomplishments, so let me show the autocorrelation functions of the files that DID run:

3D auto-correlation function

2D cross-correlation function

I think the problem is that the files which are crashing have so few data points that there are some correlation bins where there are no objects separated by that distance. I am not actually sure how the code handles this. I would hope that it would just set that bin to zero, but there is quite likely a divide by zero problem going on here. Time to insert some print statements and get to the root of this.