From this page we see how to do color contour plots: http://www.dfanning.com/tips/contour_hole.html
Here are the plots for the QSO and EE catalogs:
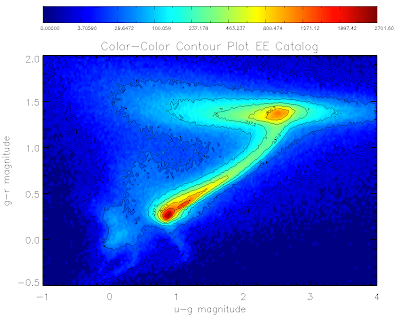
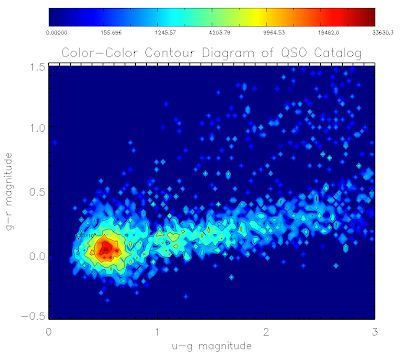
Here is the code to make them... I've used non-linear color levels to show peaks better...
For everything else catalog:
file1 = filepath('Likeli_everything.fits', root_dir=getenv('BOSSTARGET_DIR'), subdir='data')
;file1 = './Likeli_everything.fits.gz'
.com likelihood_compute
startemplate = likelihood_everything_file(file1, area=area1)
;Get magnitudes
;Star Magnitudes (don't need to deredden)
smag = 22.5 - 2.5*alog10(startemplate.psfflux>1.0d-3)
ugscolor = smag[0,*] - smag[1,*]
grscolor = smag[1,*] - smag[2,*]
;Turn on colors
device,true_color=24,decomposed=0,retain=2
;Set up fonts
!P.FONT = -1
!P.THICK = 1
DEVICE, SET_FONT ='Times Bold',/TT_FONT
bin_width = 0.025
minx=-1.0
miny=-0.5
maxx=4
maxy=2
;Create contours
star_contours = HIST_2D(ugscolor, grscolor, bin1=bin_width, bin2=bin_width, max1=maxx, MAX2=maxy, MIN1=minx, MIN2=miny)
;; This sets up (max1-min1)bin1 bins in X....
x_cont = findgen(n_elements(star_contours[*,1]))
x_cont = (x_cont*bin_width) + minx
;; And bins in y
y_cont = findgen(n_elements(star_contours[1,*]))
y_cont = (y_cont*bin_width) + miny
;Set up plot titles
xtitle = 'u-g magnitude'
ytitle = 'g-r magnitude'
mtitle = 'Color-Color Contour Plot EE Catalog'
levels = 256 ;plot in 256 colors
data = star_contours
x = x_cont
y = y_cont
white = GetColor('White', 1) ; know what is white
black = GetColor('Black', 2) ; know what is black
;load blue-red color table
LoadCT, 33, NColors=levels, Bottom=3
;define the levels of the color contours
;non linear to show data shape better
userlevels = findgen(levels)^3
maxlevel = max(userlevels)
thismax = max(star_contours)*1.1
userlevels = userlevels*thismax/maxlevel
;define the levels of the contour lines
;non linear to show data shape better
;only ten lines so that the text is legible
slevels = 10
suserlevels = findgen(slevels)^3
maxlevel = max(suserlevels)
thismax = max(star_contours)*1.1
suserlevels = suserlevels*thismax/maxlevel
; make window
Window, XSize=800, YSize=700
;Make contour plot
Contour, data, x, y, /Fill, C_Colors=Indgen(levels)+3, Background=1, Levels=userlevels, Position=[0.12, 0.1, 0.9, 0.80], Color=black, XTITLE = xtitle, YTITLE = ytitle, TITLE = mtitle, charsize = 2, charthick = 1, thick=1, xthick=2, ythick=2
;Overplot black lines
Contour, data, x, y, /Overplot, Levels=suserLevels, /Follow, Color=black
;Make color bar
ColorBar, NColors=levels, Bottom=3, Divisions=slevels-1, TICKNAMES=suserlevels, Range=[Min(data), Max(data)], Format='(G8.5)', Position = [0.12, 0.9, 0.9, 0.95], Color=black
Similarly for the qso catalog:
bin_width = 0.03
minx=0.0
miny=-0.5
maxx=3.0
maxy=1.5
qso_contours = HIST_2D(ugqcolor, grqcolor, bin1=bin_width, bin2=bin_width, max1=maxx, MAX2=maxy, MIN1=minx, MIN2=miny)
;; This sets up (max1-min1)bin1 bins in X....
x_cont = findgen(n_elements(qso_contours[*,1]))
x_cont = (x_cont*bin_width) + minx
;; And 60 bins in y
y_cont = findgen(n_elements(qso_contours[1,*]))
y_cont = (y_cont*bin_width) + miny
xtitle = 'u-g magnitude'
ytitle = 'g-r magnitude'
mtitle = 'Color-Color Contour Diagram of QSO Catalog'
levels = 256
data = qso_contours
x = x_cont
y = y_cont
white = GetColor('White', 1)
black = GetColor('Black', 2)
LoadCT, 33, NColors=levels, Bottom=3
userlevels = findgen(levels)^3
maxlevel = max(userlevels)
thismax = max(qso_contours)*1.1
userlevels = userlevels*thismax/maxlevel
slevels = 7
suserlevels = findgen(slevels)^3
maxlevel = max(suserlevels)
thismax = max(qso_contours)*1.1
suserlevels = suserlevels*thismax/maxlevel
Window, XSize=800, YSize=700
Contour, data, x, y, /Fill, C_Colors=Indgen(levels)+3, Background=1, Levels=userlevels, Position=[0.12, 0.1, 0.9, 0.80], Color=black, XTITLE = xtitle, YTITLE = ytitle, TITLE = mtitle, charsize = 2, charthick = 1, thick=1, xthick=2, ythick=2
Contour, data, x, y, /Overplot, Levels=suserLevels, /Follow, Color=black
ColorBar, NColors=levels, Bottom=3, Divisions=slevels-1, TICKNAMES=suserlevels, Range=[Min(data), Max(data)], Format='(G10.5)', Position = [0.12, 0.9, 0.9, 0.95], Color=black
And to make the plots to files:
set_plot, 'ps'
!P.FONT = 0
!P.THICK = 1
aspect_ratio = (7.0/8.0)
xsz = 7.0
ysz = xsz*aspect_ratio
device, filename = 'contourstars.eps', /color, bits_per_pixel = 8,encapsul=0, xsize=xsz,ysize=ysz, /INCHES, /TIMES, /BOLD
Contour, data, x, y, /Fill, C_Colors=Indgen(levels)+3, Background=1, Levels=userlevels, Position=[0.11, 0.1, 0.9, 0.80], Color=black, XTITLE = xtitle, YTITLE = ytitle, TITLE = mtitle, charsize = 1, charthick = 1, thick=1, xthick=2, ythick=2
Contour, data, x, y, /Overplot, Levels=suserLevels, /Follow, Color=black
ColorBar, NColors=levels, Bottom=3, Divisions=slevels-1, TICKNAMES=suserlevels, Range=[Min(data), Max(data)], Format='(G8.5)', Position = [0.11, 0.9, 0.9, 0.95], Color=black
device, /close
set_plot,'X'
!P.FONT = -1
!P.THICK = 1
DEVICE, SET_FONT ='Times Bold',/TT_FONT
bin_width = 0.03
minx=0.0
miny=-0.5
maxx=3.0
maxy=1.5
qso_contours = HIST_2D(ugqcolor, grqcolor, bin1=bin_width, bin2=bin_width, max1=maxx, MAX2=maxy, MIN1=minx, MIN2=miny)
;; This sets up (max1-min1)bin1 bins in X....
x_cont = findgen(n_elements(qso_contours[*,1]))
x_cont = (x_cont*bin_width) + minx
;; And 60 bins in y
y_cont = findgen(n_elements(qso_contours[1,*]))
y_cont = (y_cont*bin_width) + miny
xtitle = 'u-g magnitude'
ytitle = 'g-r magnitude'
mtitle = 'Color-Color Contour Diagram of QSO Catalog'
levels = 256
data = qso_contours
x = x_cont
y = y_cont
white = GetColor('White', 1)
black = GetColor('Black', 2)
LoadCT, 33, NColors=levels, Bottom=3
userlevels = findgen(levels)^3
maxlevel = max(userlevels)
thismax = max(qso_contours)*1.1
userlevels = userlevels*thismax/maxlevel
slevels = 7
suserlevels = findgen(slevels)^3
maxlevel = max(suserlevels)
thismax = max(qso_contours)*1.1
suserlevels = suserlevels*thismax/maxlevel
set_plot, 'ps'
!P.FONT = 0
!P.THICK = 1
aspect_ratio = (7.0/8.0)
xsz = 7.0
ysz = xsz*aspect_ratio
device, filename = 'contourqsos.eps', /color, bits_per_pixel = 8,encapsul=0, xsize=xsz,ysize=ysz, /INCHES, /TIMES, /BOLD
Contour, data, x, y, /Fill, C_Colors=Indgen(levels)+3, Background=1, Levels=userlevels, Position=[0.12, 0.1, 0.9, 0.80], Color=black, XTITLE = xtitle, YTITLE = ytitle, TITLE = mtitle, charsize = 1, charthick = 1, thick=1, xthick=2, ythick=2
Contour, data, x, y, /Overplot, Levels=suserLevels, /Follow, Color=black
ColorBar, NColors=levels, Bottom=3, Divisions=slevels-1, TICKNAMES=suserlevels, Range=[Min(data), Max(data)], Format='(G10.5)', Position = [0.12, 0.9, 0.9, 0.95], Color=black
device, /close
set_plot,'X'
!P.FONT = -1
!P.THICK = 1
DEVICE, SET_FONT ='Times Bold',/TT_FONT
See they look pretty:
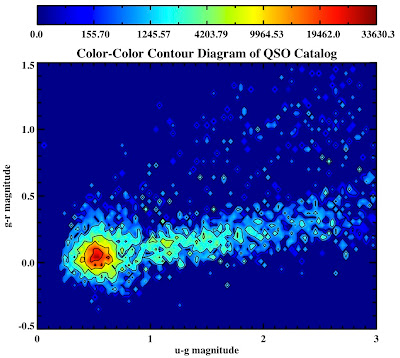
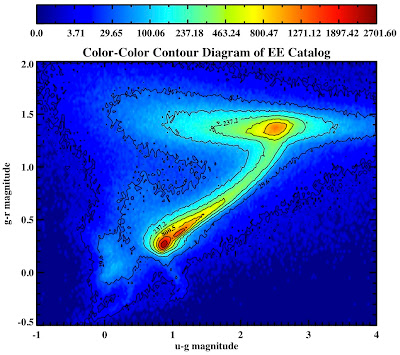
All in the following log file:
../logs/100816log.pro




